
Figure 5.
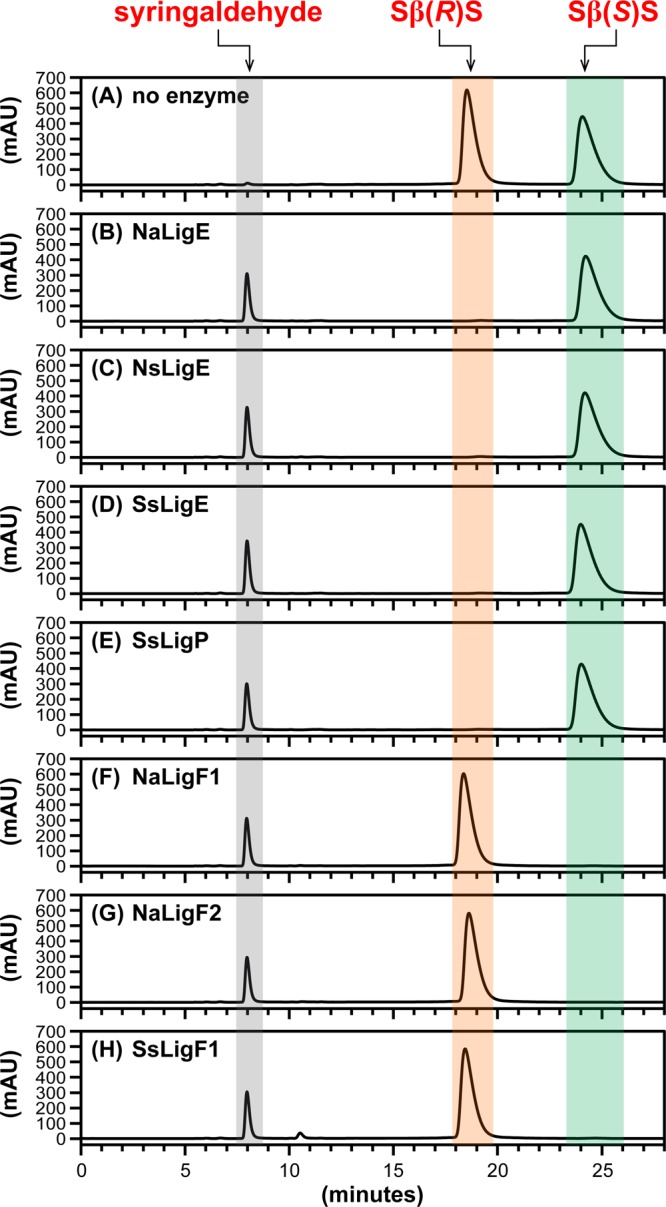
HPLC chromatographic traces (CHIRALPAK AY-H column, λ = 280 nm) of β-etherase enzyme assay samples from cosubstrates racem-SβS and glutathione. Chromatographic regions for syringaldehyde (gray), Sβ(R)S (orange), and Sβ(S)S (green). peak elution times are highlighted by shading. (A) No enzyme added, 0 h sample, where the ratio of peak area integrals of Sβ(R)S to Sβ(S)S was ∼1:1. After 1 h incubation with either enzymatic catalyst: (B) NaLigE, (C) NsLigE, (D) SsLigE, (E) SsLigP, (F) NaLigF1, (G) NaLigF2, or (H) SsLigF1. Structures of syringaldehyde, Sβ(R)S, and Sβ(S)S are shown in Figure 1D. Abbreviations: Na, N. aromaticivorans strain DSM12444; Ns, Novosphingobium sp. strain PP1Y; Ss, Sphingobium sp. strain SYK-6. See Experimental Section for details.