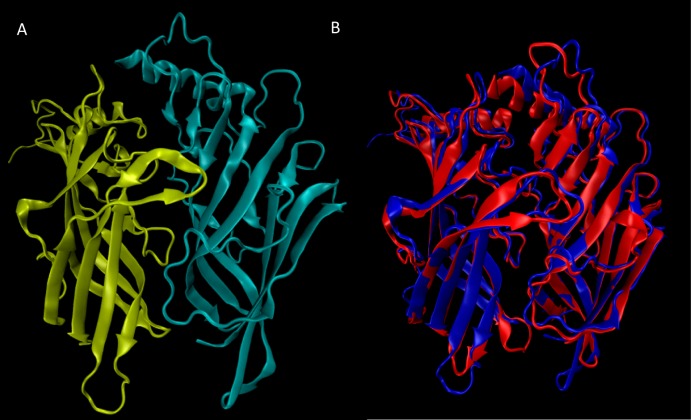
Figure 5.
Homology model of the human α4β2-nAChR ECD including the ligand binding interface: (A) ribbon structure representation colored by subunit (yellow, α4; azure, β2) for the human α4β2-nAChR ECD and (B) superimposition of the modeled structure (in blue) with the experimental template from Ct-AChBP (in red).

