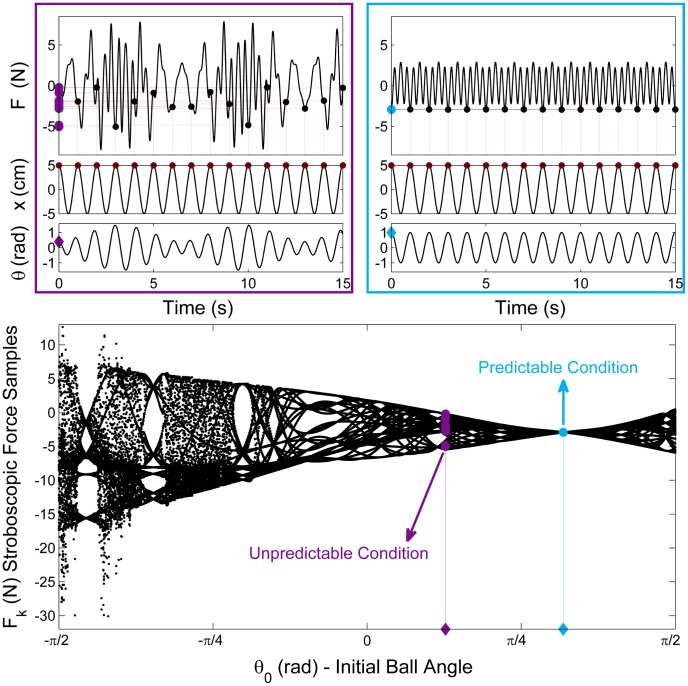
Figure 3. Two profiles of force and cup and ball displacement exemplify unpredictable dynamics (left) and predictable dynamics (right).
The strobing procedure is illustrated by the dots and the vertical lines: at every peak of the cup displacement, the value of force is picked; the strobed force values are then projected onto the vertical axis to show the distribution for each simulation. The left example shows a scattered distribution, while the right periodic profile only shows one value. The bifurcation diagram summarizes all force distributions as a function of the parameter  , the initial ball angle. The vertical axis displays the stroboscopic samples of force values
  , simulated from a 1.0 Hz sinusoidal cup displacement
  with 10 cm (full peak-to-peak) amplitude and
  rad/s. The horizontal axis shows the initial ball angle
  . The plot shows that when the simulation starts from the initial angle
  = 1.0rad, the strobed force values do not change in successive cycles (blue), corresponding to the time profile on the right. At
  rad, there is variance in the strobed values of force
  , corresponding to the plot on the left (purple). The variance of
  was used to define a measure for the predictability of object's dynamics (see Predictability Index in the supporting Text S1).

