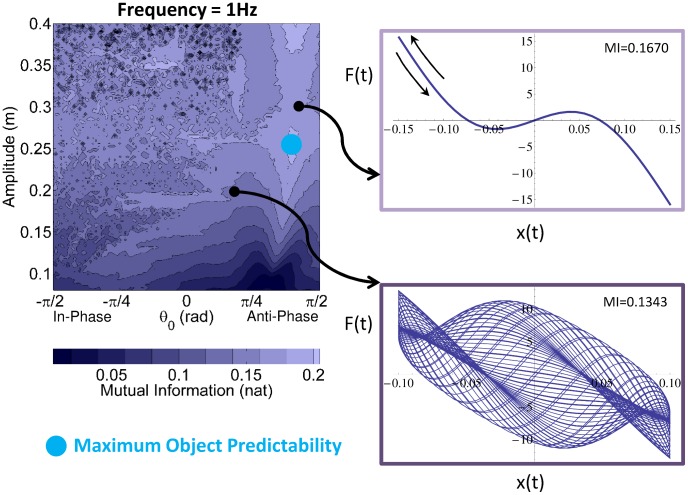
Figure 4. Map of Mutual Information in the 2D result space spanned by amplitude  and initial ball angle
  (left) and examples of force-kinematics relationship (right).
The color map shows that realization of a 1.0 Hz sinusoidal cup trajectory with different amplitudes and initial angles differ in the resulting predictability of the object dynamics. Mutual Information, coded by color shades, describes the predictability of the object's behavior for a 1.0 Hz sinusoidal cup trajectory with different  and
and  . The light blue circles indicate the strategies with the highest predictability of object's dynamics. The force-cup displacement plots on the right correspond to 2 representative points (strategies) in the result space. The profile on the top right shows high Mutual Information with consistent force-kinematic relationship over successive cycles (arrows indicate the traversal on the same constant curve over consecutive cycles). The profile on the bottom right shows a strategy with low Mutual Information, where the force-kinematic relationship changes in every cycle.

