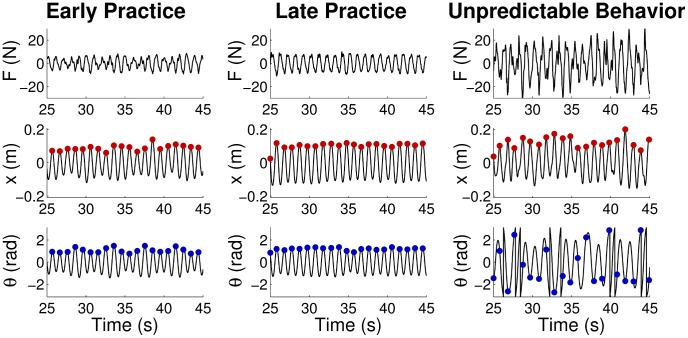
Figure 7. Representative profiles of raw experimental data from early and late practice.
 is the interaction force between the subject and robot,
  is the displacement of the cup (end-effector), and
  is the angle of the ball. The time of peak cup positions (shown by red dots) served as time reference to strobe the ball angular displacement
  and define
  . Notice that the relatively irregular patterns of cup displacement and especially force in early practice became more regular and also larger in amplitude later in practice. An example of a highly unpredictable or chaotic behavior is shown on the right. Notice the negative values of
  , which indicate the chaotic regime, shown in Figure 4. The Mutual Information measure for these continuous experimental data are 0.1256nat (early practice), 0.1693nat (late practice), and 0.1295nat (unpredictable behavior).

