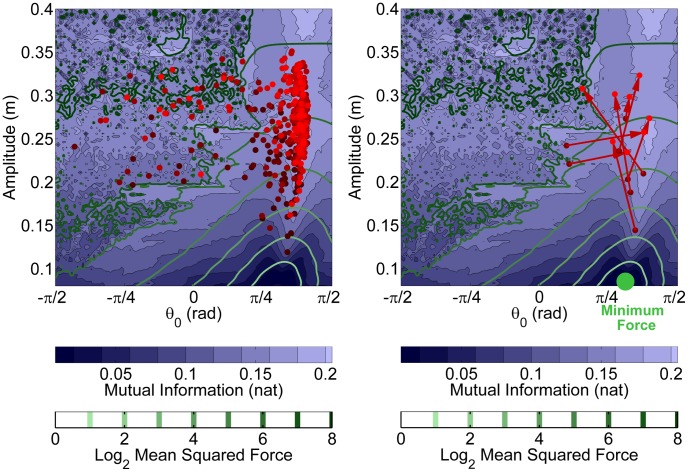
Figure 9. Strategies for all subjects and all trials displayed in the 2D result space.
The horizontal axis corresponds to the simulation variable  or its average experimental estimates
  in each trial. The vertical axis corresponds to the simulation variable
  or its average experimental estimates
  . Each point represents the average strategy in one 45 s trial. Darker red indicates early practice and lighter red indicates late practice. The left panel shows that subjects explored regions with lower Mutual Information and lower Mean Squared Force; however, the majority of trials converged to areas with higher Mutual Information and lower Sensitivity. The right panel shows the same data separated by subject: the red arrows mark how each subject's average strategy changed from early practice (first 5 trials) to late practice (last 5 trials). All subjects increased their movement amplitude, associated with an increase in overall exerted force. The majority of subjects switched from low- to high-predictability regions in the result space. None of the subjects moved toward the minimum force strategy.

