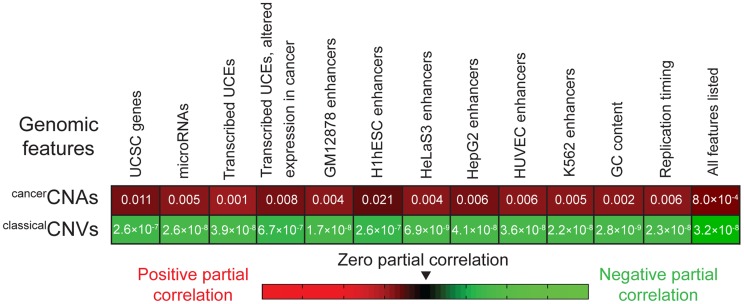
Figure 2. Partial correlation analyses.
The positive correlation between the positions of UCEs and cancerCNAs (first row) and the negative correlation between the positions of UCEs and classicalCNVs (second row) remain even after accounting for the correlation between the positions of UCEs and the genomic features listed across the top. P-values correspond to analyses in which the genome was divided into 50 kb windows and then assessed for the number of base pairs encompassed by the various genetic features within each window. Analyses using 10 kb and 100 kb bins also produced significant values across the board.

