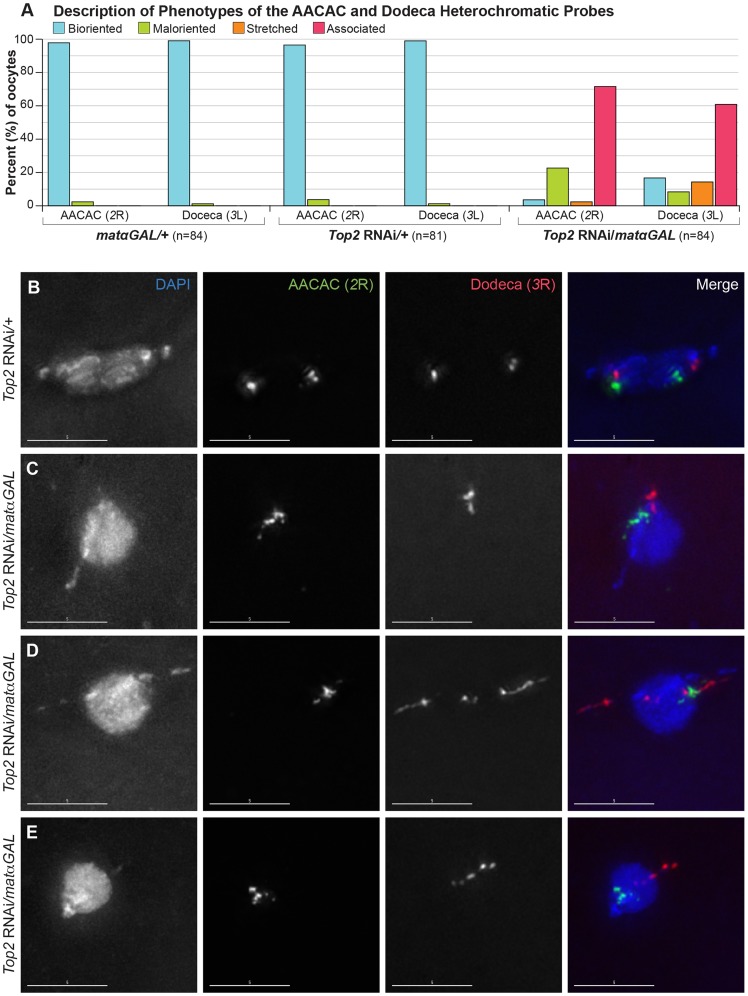
Figure 5. Top2 RNAi/matαGAL oocytes show defects in chromosome biorientation and in the separation of heterochromatic regions of the 2nd and 3rd chromosomes.
(A) Quantification of the phenotypes observed for the AACAC and Dodeca heterochromatic probes. Bioriented represents oocytes with two FISH probe foci oriented in opposite directions. Maloriented represents two FISH probe foci oriented in the same direction. Stretched represents FISH signal that is highly elongated rather than discreet foci. Associated represents oocytes with only a single FISH probe focus. (B–E) DNA is labeled with DAPI (blue), a FISH probe targeting the AACAC repeat on the right arm of the 2nd chromosome is in green, and a FISH probe to the Dodeca heterochromatic repeat on the right arm of the 3rd chromosome is shown in red. (B) Top2 RNAi/+ control oocyte with two foci for both probes oriented in opposite directions, indicating proper biorientation of the 2nd and 3rd chromosomes. (C–E) Examples of Top2 RNAi/matαGAL oocytes displaying aberrant separation of heterochromatic regions. (C) Probes indicate that both heterochromatic regions have failed to separate. (D) The AACAC heterochromatic region of the 2nd chromosomes has failed to separate. The Dodeca heterochromatic region of the 3rd chromosome has separated but the heterochromatic region is highly stretched out and present in the abnormal DNA projections. (E) Both heterochromatic regions appear abnormal and the 2nd and 3rd chromosomes are improperly oriented so as to segregate away from each other. Images are projections of partial Z-stacks. Scale bars are 5 microns.

