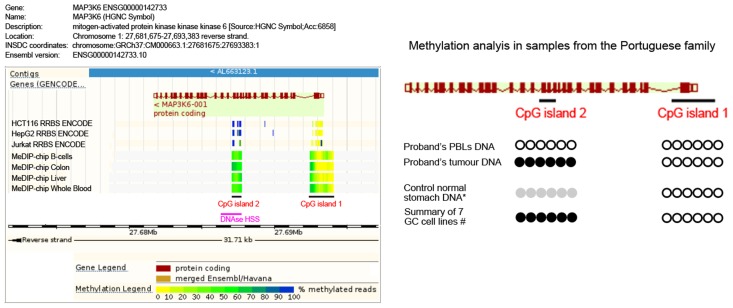
Figure 5. Methylation analysis of the Portuguese family.
Left panel: Schematic representation of the MAP3K6 gene adapted from Ensembl genome browser (release 75). The two CpG islands analyzed are represented. CpG island 1 is mainly non-methylated for several normal tissues and cells lines represented in the scheme, while CpG island 2 displays low methylation frequency (light green) in normal tissues such as B-cells, Colon, Liver and Whole Blood, and high methylation (blue) in colon (HCT116), liver (HepG2) and blood (Jurkat) cancer cell lines. A DNase HSS predicted to harbor a promoter-associated regulatory element overlapping with CpG island 2. Right panel: For the CpG island 1, no hypermethylation was detected (white circles). For the CpG island 2, we observed complete methylation in the proband's tumor DNA (black circles) and no methylation in the PBLs' DNA. The DNA of normal gastric mucosa from controls displayed partial methylation (grey circles). All gastric cancer cell lines mimicked the full methylation observed for the tumor DNA (black circles).

