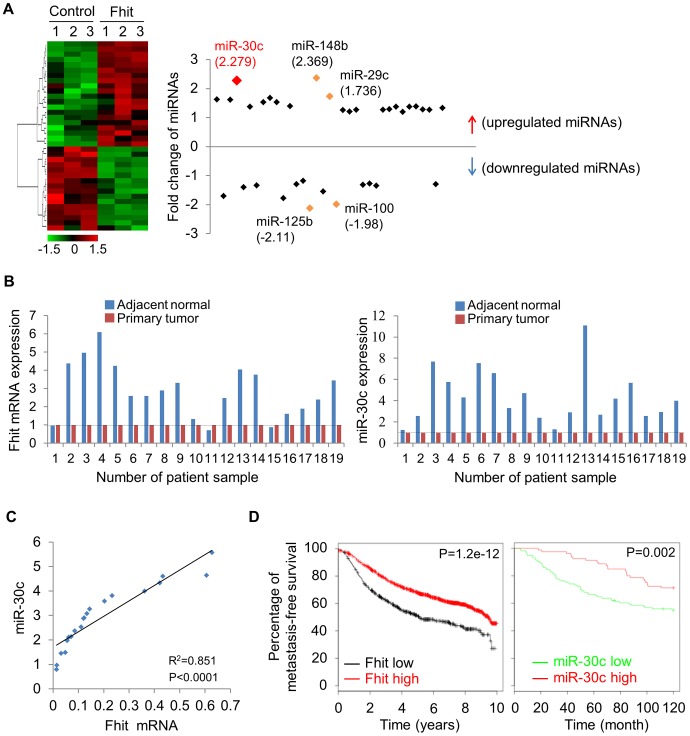
Figure 3. FHIT expression leads to activation of miR-30c in lung cancer.
(A) Unsupervised hierarchical clustering of FHIT-regulated miRNAs in H1299/FHIT cells; P<0.05 (B) RT-qPCR analysis showing up-regulation of FHIT and miR-30c in adjacent normal tissues compared to tumor tissues (n = 19). (C) XY scatter plots showing positive correlation between FHIT and miR-30c in primary lung tumors (n = 20). (D) Kaplan-Meier plots of metastasis-free survival of breast cancer patients, stratified by expression of FHIT (2290 patients) or miR-30c (210 patients). Data obtained from the Kaplan-Meier plotter database (kmplot.com/analysis) or microRNA survival analyses in cancer (www.bioprofiling.de).

