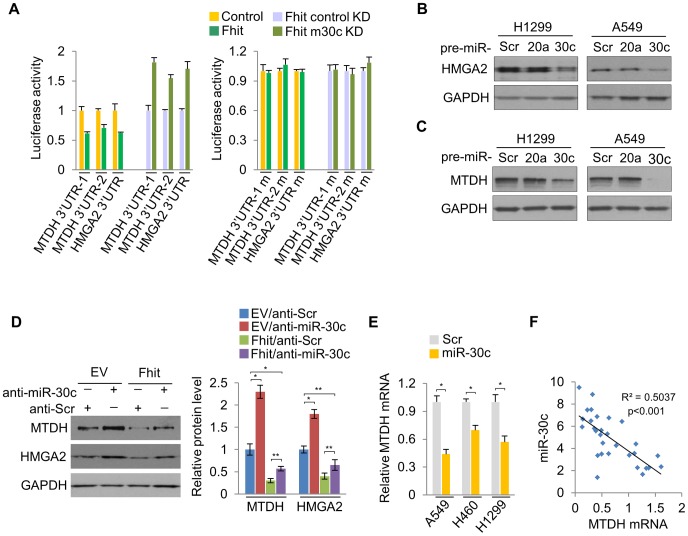
Figure 5. miR-30c down-regulates the expression of MTDH and HMGA2 by directly targeting their 3′UTRs.
(A) Luciferase activity assays of luciferase reporters with wild type or mutant 3′UTRs of MTDH or HMGA2 were performed after transfection into A549/FHIT or A549/FHIT cells with miR-30c knockdown. (B), (C) Western blot analysis for HMGA2 or MTDH in miR-30c-transfected cells, H1299 and A549. miR-20a was another negative control. (D) MTDH or HMGA2 protein levels in anti-miR-30c-transfected cells stably expressing FHIT. (E) RT-qPCR for MTDH in presence of miR-30c. (F) Correlation between expression levels of miR-30c and MTDH in NSCLC samples (n = 30). Pearson's correlation was used. y, the relative expression level of miR-30c, U6, as an internal control. x, the relative expression level of MTDH, GAPDH, as an internal control. Experiments were performed three times and the data are presented as the mean ± s.d. *P<0.01 and **P<0.001 by Student's t-test.

