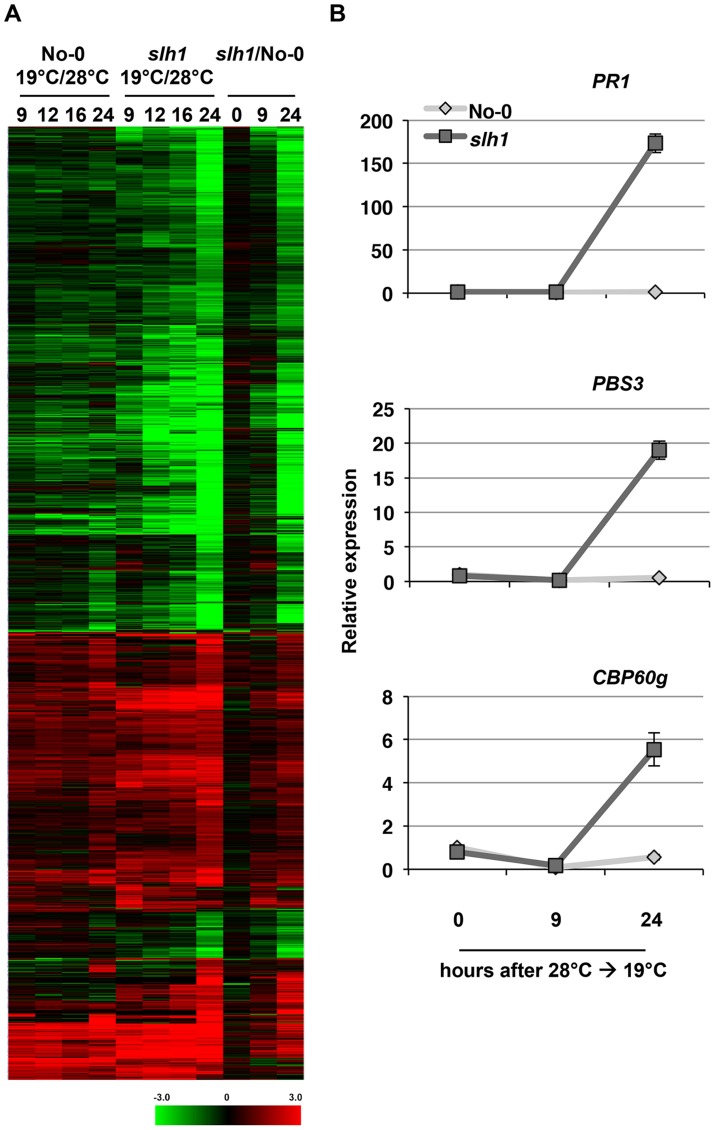
Figure 3. Low temperature-dependent transcription profiling of the slh1 mutant.
(A) Hierarchical clustering of No-0 and slh1 temperature-dependent differential gene expression. Fold-change values of 5611 genes (differentially expressed at least in one time point) are shown. The numbers on top of the heat map indicate the time (h) after temperature shift. Black, red and green colours indicate no change, up-regulated and down-regulated, respectively. (B) qRT-PCR analysis of selected RRS1SLH1-regulated genes following the temperature shift (28°C to 19°C) in 4 week-old No-0 and slh1 plants. Transcript accumulation is presented relative to No-0 before temperature shift (28°C).

