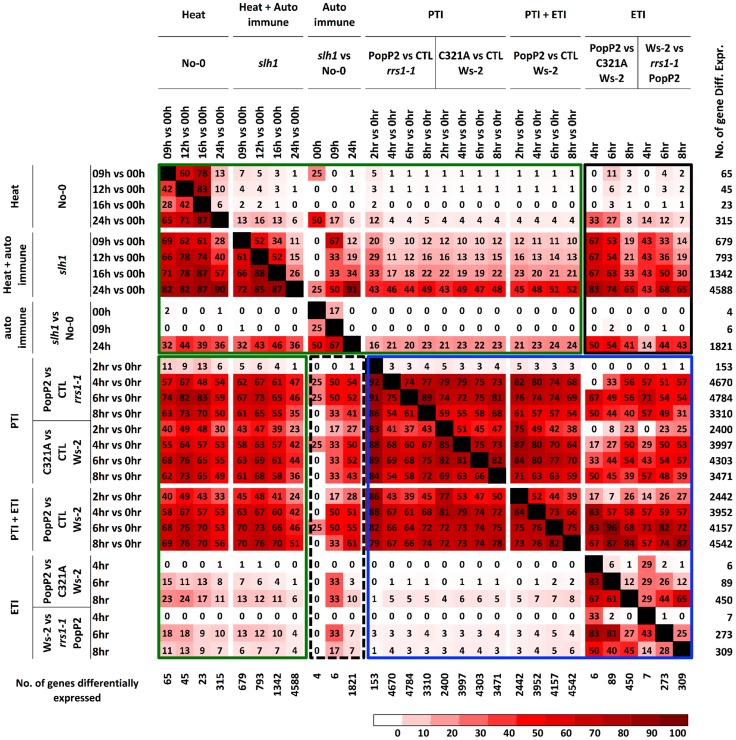
Figure 4. Percentage pairwise overlap of genes differentially expressed during the time course of PopP2 or PopP2C321A on Ws-2 and rrs1-1 and the time course of temperature shift on No-0 and slh1.
Each time course response is categorized based on underlying response (PTI, ETI, temperature shift, auto-immunity and combinations). Each cell represents percentage of genes differentially expressed from the column experiment that were also differentially expressed in the row experiment. Green boxes highlight genes regulated by heat stress and PTI, PTI+ETI responses; blue box highlights genes regulated by PTI, ETI and PTI+ETI; black boxes highlight genes regulated by auto-immunity, heat stress and by PTI, ETI and PTI+ETI. The number of gene differentially expressed in each time course is indicated on the right. PTI, PopP2C321A-regulated genes; ETI, PopP2WT- but not PopP2C321A-regulated genes; temperature shift, temperature shift-regulated genes in No-0 wild-type; auto-immunity, temperature shirt-regulated genes in slh1 mutant but not in No-0 wild-type.

