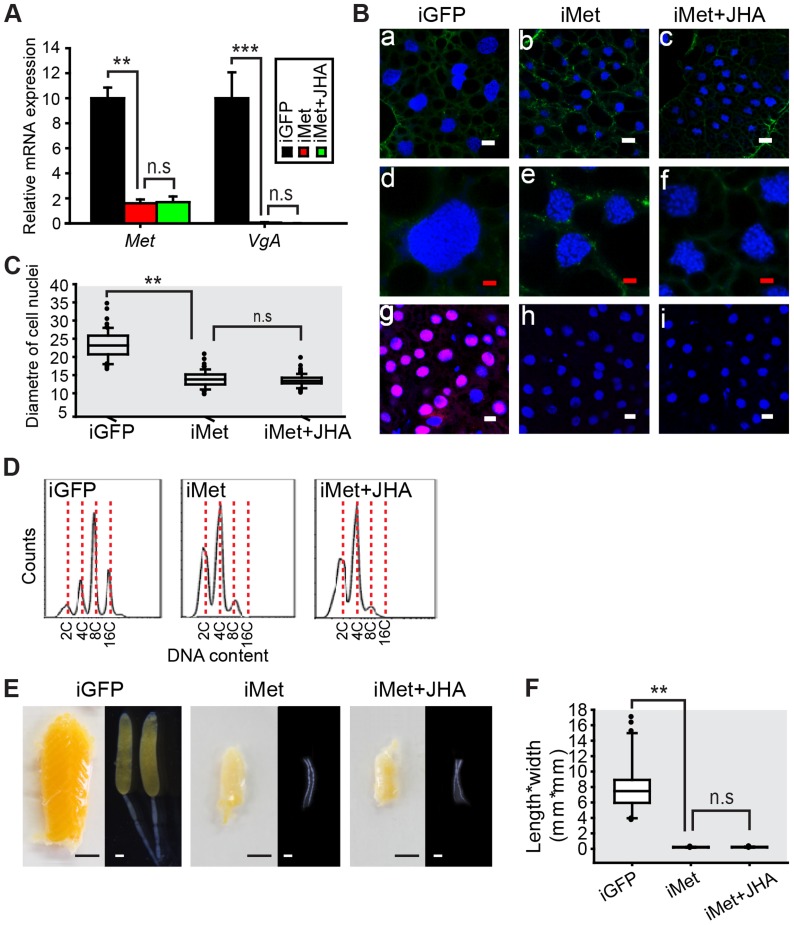
Figure 3. Effects of Met RNAi on DNA replication and vitellogenesis.
(A) Met knockdown efficiency and VgA mRNA levels in the fat body of the dsGFP control (iGFP), Met RNAi (iMet), and iMet further treated with methoprene for 48 h (iMet+JHA). **, P<0.01 and ***, P<0.001; n.s, no significant difference; n = 4–6. (B) Fat body cell ploidy (a–f) and DNA synthesis (g–i) of iGFP, iMet and iMet+JHA. Blue, nuclei; green, F-actin; red, de novo DNA synthesis. Enlarged images (4×) of a–c are shown in d–f, respectively with the white bar, 20 µm and red bar, 5 µm. (C) Statistical analysis for the diameter of cell nuclei. **, P<0.001; n = 80–100. (D) FACS analysis of DNA contents in fat body cells. (E) Representative phenotypes of ovaries and ovarioles after iMet, iMet+JHA vs. iGFP. (F) Statistical analysis for length*width index of primary oocytes. ***, P<0.001; n = 30.

