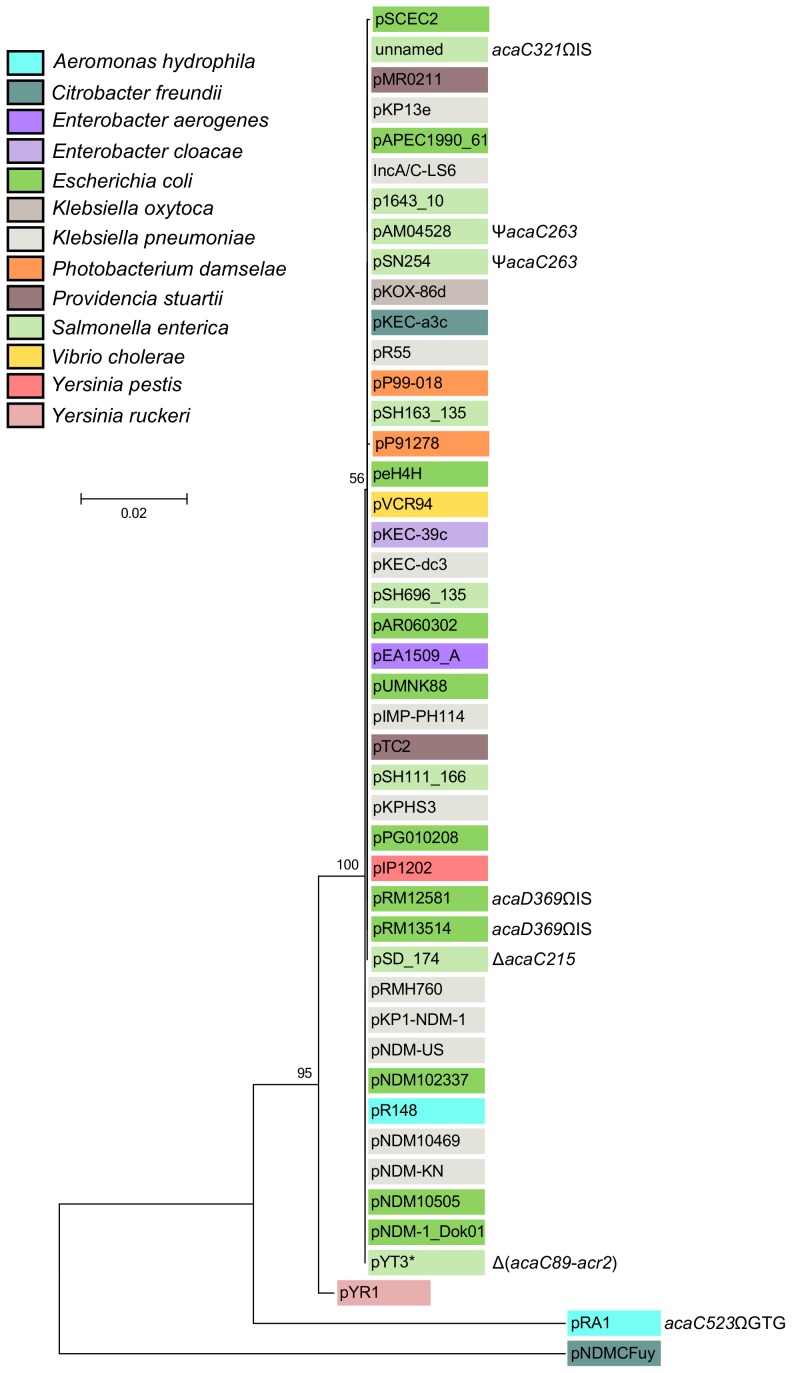
Figure 2. Molecular phylogenetic analysis of the acr1-vcr147-acaDC-acr2 locus by Maximum Likelihood method.
The evolutionary history was inferred by using the Maximum Likelihood method based on the Kimura 2-parameter model [61]. The tree with the highest log likelihood (−5461.6977) is shown. The percentage of trees in which the associated taxa clustered together is shown next to the branches. A discrete Gamma distribution was used to model evolutionary rate differences among sites (5 categories (+G, parameter = 0.6567)). The tree is drawn to scale, with branch lengths measured in the number of substitutions per site. The analysis involved 45 nucleotide sequences (Table S2). Codon positions included were 1st+2nd+3rd+Noncoding. There were a total of 2469 positions in the final dataset. Evolutionary analyses were conducted in MEGA6 [58]. The background color of each leaf indicates the original host species from which each plasmid was isolated. Insertions (Ω), deletion (Δ) and frameshift (Ψ) mutations are indicated where appropriate. *, Although pYT3 shares sequence identity with the IncA/C plasmids, it lacks an IncA/C-specific replication initiation gene (repA) and contains an IncFIB replicon instead (Figure S1) [62].

