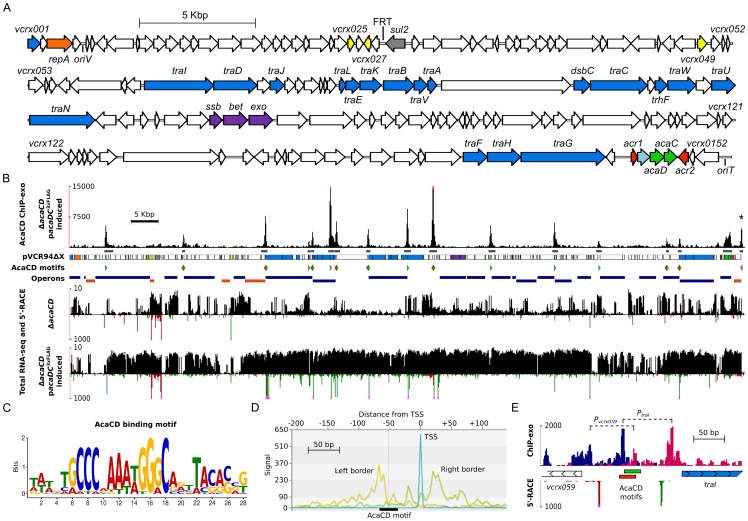
Figure 3. In-depth analysis of the AcaCD regulon in pVCR94.
(A) Genetic organization of pVCR94ΔX adapted from Carraro et al. [19]. The circular map of the plasmid was linearized at the start position of gene vcrx001. The locations and orientations of ORFs are indicated by arrowed boxes. Colors are coded by function as follow: white, unknown; blue, conjugative transfer; light blue, lytic transglycosylase; orange, replication; gray, antibiotic resistance; yellow, putative regulatory function; purple, recombination; green, activator; red, repressor. The origin of replication (oriV) and the origin of transfer (oriT) are also indicated. The position of the scar resulting from the deletion of the antibiotic resistance gene cluster is indicated by FRT. sul2, resistance to sulfamethoxazole. (B) Results of ChIP-exo and RNA-seq experiments on E. coli MG1655 Rf carrying pVCR94ΔacaCD with or without a single chromosomal copy of pacaDC 3×FLAG expressing the native AcaD subunit along with a C-terminal 3×FLAG-tagged AcaC subunit induced by IPTG. The first track plots the number of ChIP-exo reads mapped as a function of the position in pVCR94ΔX (black bars). Pink dots at the top of peaks indicate a signal beyond the represented y-axis maximal value. The second track shows the position of ChIP-exo enrichment peaks found by MACS [63] (dark gray). The asterisk at the top of the rightmost peak indicates a MACS false negative result manually incorporated in the figure. The third track is a representation of the pVCR94ΔX genes using the same color code as in panel A. The fourth track indicates the position of the AcaCD-binding motifs found by MAST [64] within ChIP-exo peaks using the AcaCD logo shown in panel C. Green arrows, motifs on positive DNA strand; red arrows, motifs on negative DNA strand. The fifth track represents Rockhopper's [65] predicted operons. Dark blue, operons transcribed from positive DNA strand; orange, operons transcribed from negative DNA strand. The remaining four tracks show the total RNA-seq read densities (black bars; log scale) and the genome-wide 5′-RACE signals (green and red bars respectively on the positive and negative DNA strands; linear scale) for cells harboring either pVCR94ΔacaCD or pVCR94ΔacaCD complemented with pacaDC 3×FLAG and induced by IPTG. Pink dots at the top of 5′-RACE signals indicate a signal beyond the represented y-axis maximal value. (C) Motif sequence recognized by AcaCD in pVCR94ΔX obtained by MEME [64] using the AcaCD-binding sequences generated from ChIP-exo experiments. (D) VAP aggregate profile [66] showing ChIP-exo and 5′-RACE density signals centered on the AcaCD-binding motif (black box). Yellow line, density of reads mapping on the positive DNA strand (Left border); green line, density of reads mapping on the negative DNA strand (Right border). X-axis displays the distance in nucleotides from the aggregated transcription start site shown in blue (TSS). (E) Organization of vcrx059 and traI divergent promoters revealed by ChIP-exo and 5′-RACE for pVCR94ΔacaCD complemented with IPTG-induced pacaDC 3×FLAG. The first track plots ChIP-exo read densities at single nucleotide resolution as in panel D. Dark blue, density of reads mapping on the positive DNA strand; magenta, density of reads mapping on the negative DNA strand. The second track shows the two AcaCD-binding motifs found by MAST within the ChIP-exo peak between vcrx059 (white arrows) and traI (blue arrows) genes. Motif corresponding to the positive DNA strand is represented in green and motif corresponding to the negative DNA strand is shown in red. The last track represents 5′-RACE signals as described in panel B. The exonuclease-protected regions of the vcrx059 and traI promoters are indicated by dashed lines.

