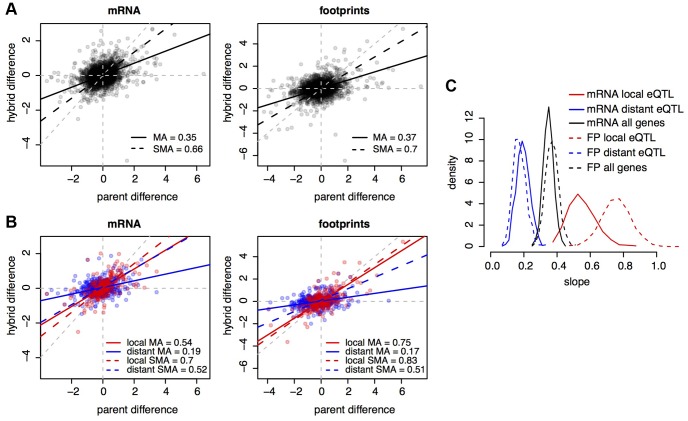
Figure 4. Cis and trans effects.
A. Parental differences (estimated based on SNP allele counts) on the x-axes, and hybrid differences on the y-axes, for all genes. Black lines show the slope of the relationship between hybrid and parental differences. The legends indicate the values of these slopes. MA: major axis estimate; SMA: standardized major axis estimate. B. as in A), but only for genes with eQTL in [29]. Red: genes with a local but no distant eQTL, blue: genes with a distant but no local eQTL, purple: genes with both a local and a distant eQTL. Colored lines show the respective regressions of hybrid on parental differences. C. bootstrapped distributions of MA slope estimates. Results from SMA were qualitatively similar.

