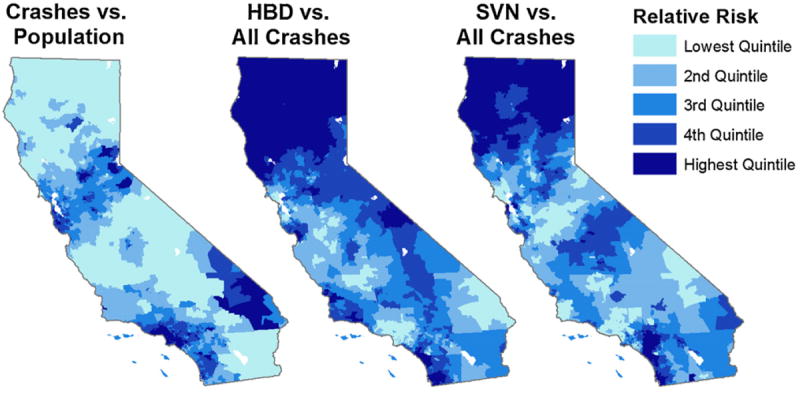
Fig. 1.

Comparing residual spatial variation across models: quintiles for 2008 CAR random effects. Legend: Posteriors of CAR random effects are for the models without spatially-lagged outlets effects as shown in Table 2. The maps would be very similar using the analyses that include spatially-lagged outlet effects (Table 3). The lighter shade represents the 20% of ZIP codes with the lowest spatial risk not explained by covariates, while the darker shade represents the highest 20% in terms of residual spatial risk. The residual spatial risk for the highest quintile of ZIP codes is at least 2.8 times that of the lowest quintile in the analysis of injury crashes relative to population. The highest quintile’s residual spatial risk is at least 35% higher than the lowest quintile for HBD crashes relative to all injury crashes, and at least 22% higher for SVN crashes relative to all injury crashes.
