Figure 3.
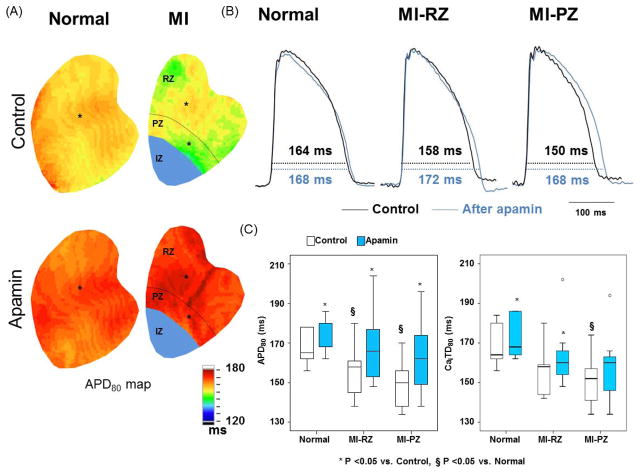
Effects of apamin on APD80 and CaiTD80 in normal and infarct ventricles. A, Typical APD80 maps before and after apamin in normal and infarct ventricles. B, Black and blue lines indicated the optical Vm tracing before and after application of apamin, respectively. The tracings were obtained from the site labeled by an asterisk in A. C, Magnitude of APD80 (left panel) and CaiTD80 (right panel) prolongation before and after apamin in 6 normal and 7 infarct ventricles. Paired t tests show significant prolongation of CaiTD80 before (control) and after adding apamin.

