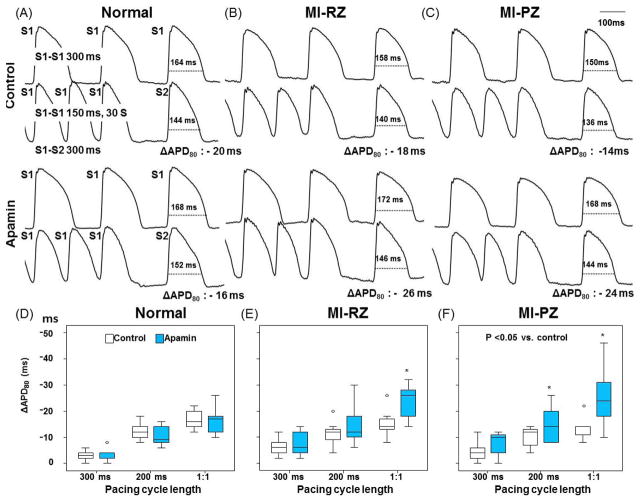
Figure 4.
Effects of apamin on action potential duration (APD) at the cessation of rapid pacing. In A through C, the first and third rows show action potential at PCL of 300 ms followed by S2 with S1–S2 of 300 ms. The second and fourth rows show APs during rapid pacing followed by a postpacing (S2) beat at 300 ms coupling interval. The difference between APD80 of S2 and that of S1 at 300 ms PCL is the ΔAPD80. The same pacing protocol was performed before and after apamin. D and F show effect of apamin on ΔAPD80 of each pacing cycle length in normal, MI-RZ and MI-PZ, respectively. 1:1 indicates the shortest PCL associated with 1:1 capture. The average shortest PCL associated with 1:1 pacing in normal and MI ventricles were 153.3 [95% CI, 144.8 to 161.9] ms and 161.4 [95% CI, 150.2 to 172.7] ms, respectively (P=0.194). The asterisk indicates p<0.05 between control and apamin at each PCL.

