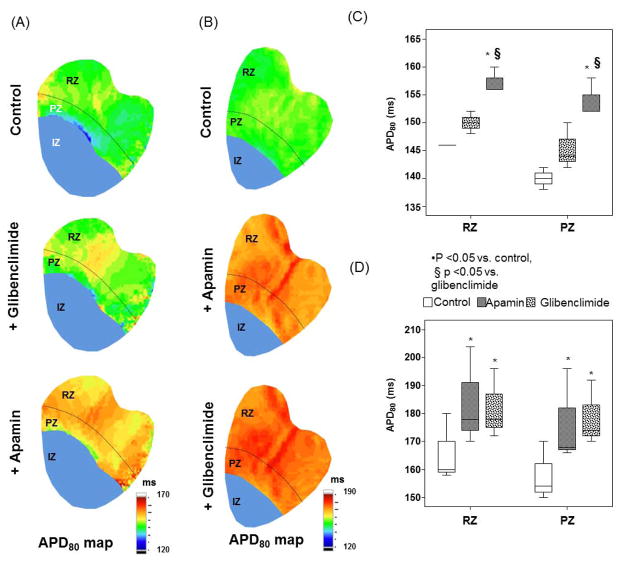
Figure 5.
Effects of glibenclamide given on action potential duration (APD80). A shows the APD80 distribution at baseline control, after adding glibenclamide (middle panel) and finally after adding apamin (bottom panel) in a typical example. C shows the box plot of the values throughout the mapped region. Note that there were no significant differences of APD80 between control and glibenclamide, but APD80 lengthened significantly after apamin was added. B shows the APD80 distribution at baseline, after apamin (middle panel) and after both apamin and glibenclamide (bottom panel). D shows the box plot of the values throughout the mapped region. Note that the APD80 prolonged significantly after adding apamin, but no further prolongation was noted when glibenclamide was added. The infarcted or ischemic epicardial areas were marked by blue color. They were excluded from the analyses.

