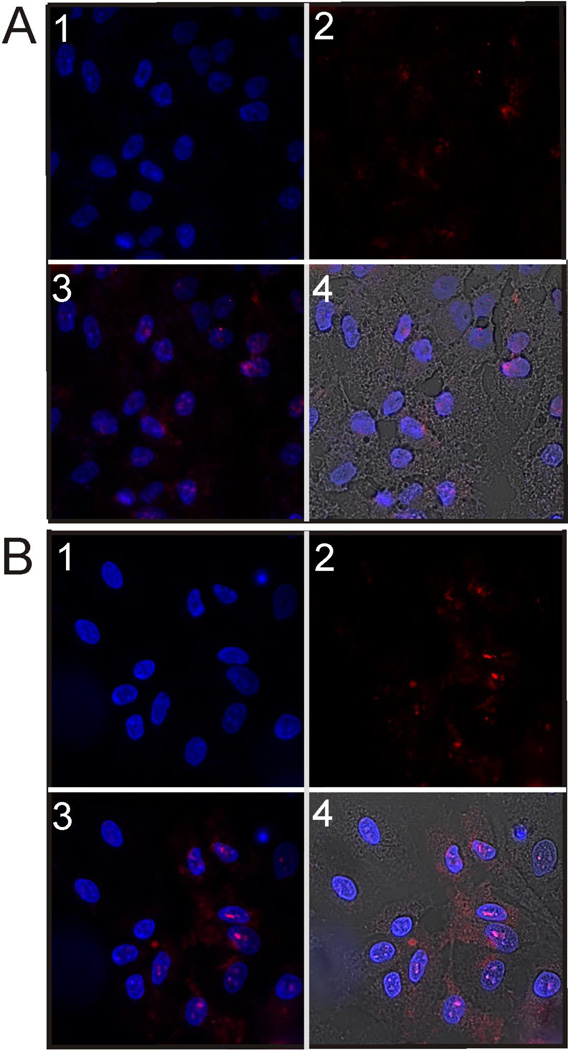
Figure 13.
Micrographs of (A) TAT-PEG/DNA complexes and (B) 50% TAT-PEG-LABL/DNA complexes in A549 cells (activated with TNF-α) after 4 hrs of incubation at 37°C. Complexes were formed at an N/P ratio of 30 and a CaCl2 of 150 mM. (1 = DAPI fluorescence (cell nuclei), 2 = TOTO-3 fluorescence (DNA), 3 = Merged DAPI and TOTO-3 fluorescence, 4 = Merged DAPI, TOTO-3 fluorescence, and bright field transmission.)

