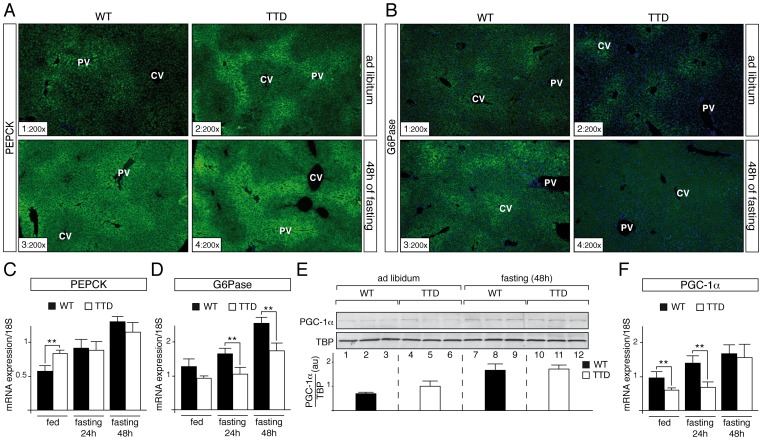
Figure 2. Dysregulation of gluconeogenesis-induced proteins in TTD liver.
PEPCK (panel A) and G6Pase (panel B) immunostainings of liver sections from ad libitum (sections 1–2) and 48 h fasted (sections 3–4) WT and TTD mice. PV = Portal Vein; CV = Central vein. Magnification is indicated at the bottom left of each part. Expression of the hepatic fasting-induced Pepck (panel C) and G6pase (panel D) genes in WT (black boxes, n = 4) and TTD (open boxes, n = 4) fed normally or fasted for 24 h or 48 h. Results are expressed as the mean normalized to 18S RNA. (panel E) Western Blot analyses of PGC-1α (110 kDa) levels in the liver of three WT and three TTD fed normally (lanes 1–6) or fasted for 48 h (lanes 7–12). TBP (TATA box Binding Protein, 36 kDa) has been used as an internal control. Diagram represents the mean of the ratios between PGC-1α and TBP for each group. (panel F) Expression of the Pgc-1α gene in WT (black boxes, n = 4) and TTD (open boxes, n = 4) fed normally or fasted for 24 h or 48 h. Results are expressed as the mean normalized to 18S RNA. Error bars represent standard deviations. The statistical symbols reflect significant differences between genotypes (**, p<0.01, Student's t-test).

