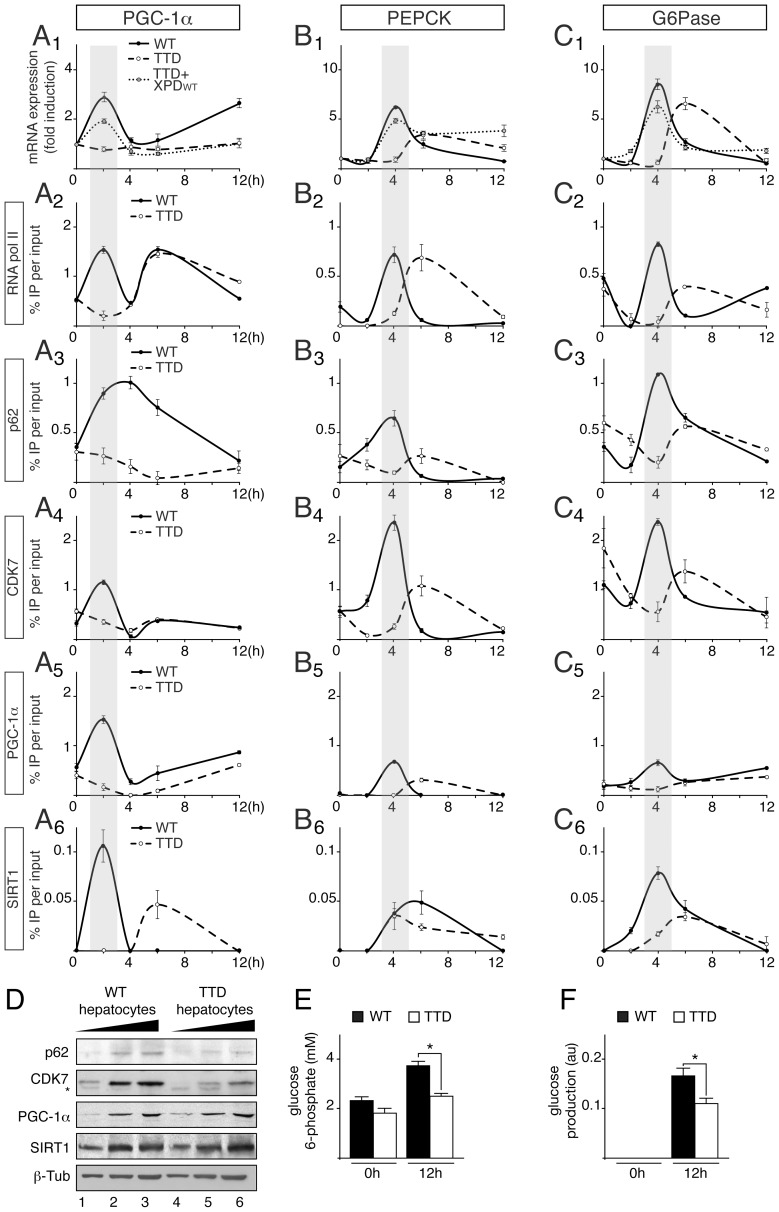
Figure 3. Defective recruitments of transcription factors on the promoter of gluconeogenic genes in TTD hepatocytes.
Expression of Pgc-1α (panel A1) Pepck (panel B1) and G6Pase (panel C1) genes in WT (solid curves), TTD (dashed curves) and TTD overexpressing XPDwt (dotted curves) hepatocytes after pyruvate treatment. The results are presented as n-fold induction relative to non-treated cells. Recruitment of RNA pol II, p62, CDK7, PGC-1α and SIRT1 on the proximal promoter of PGC-1α (panels A2 to A6), PEPCK (panels B2 to B6) and G6Pase (panels C2 to C6) in WT (dotted curves) and TTD (dashed curves) hepatocytes. The results of three independent experiments are presented as percentage of DNA immunoprecipitated relative to the input. The shaded areas underline the concomitant recruitments of the transcription factors with the expression profile of the target genes in WT hepatocytes. (panel D) Western blot analyses of TFIIH, illustrated by its p62 (62 kDa) and CDK7 (39 kDa) subunits, PGC-1α (110 kDa) and SIRT1 (110 kDa) with increasing amounts of whole cell extracts isolated from WT (lanes 1–3) and TTD (lanes 4–6) hepatocytes. β-tubulin (β-Tub, 50 kDa) has been used as an internal control. * indicates unspecific band. Measurement of intracellular glucose 6-phosphate (panel E) and glucose output (panel F) levels from WT (black boxes) and TTD (open boxes) hepatocytes after 0 and 12 hours of pyruvate treatment. Values represent the means ± SEM. The statistical symbols reflect significant differences between genotypes (*, p<0.05, Student's t-test).

