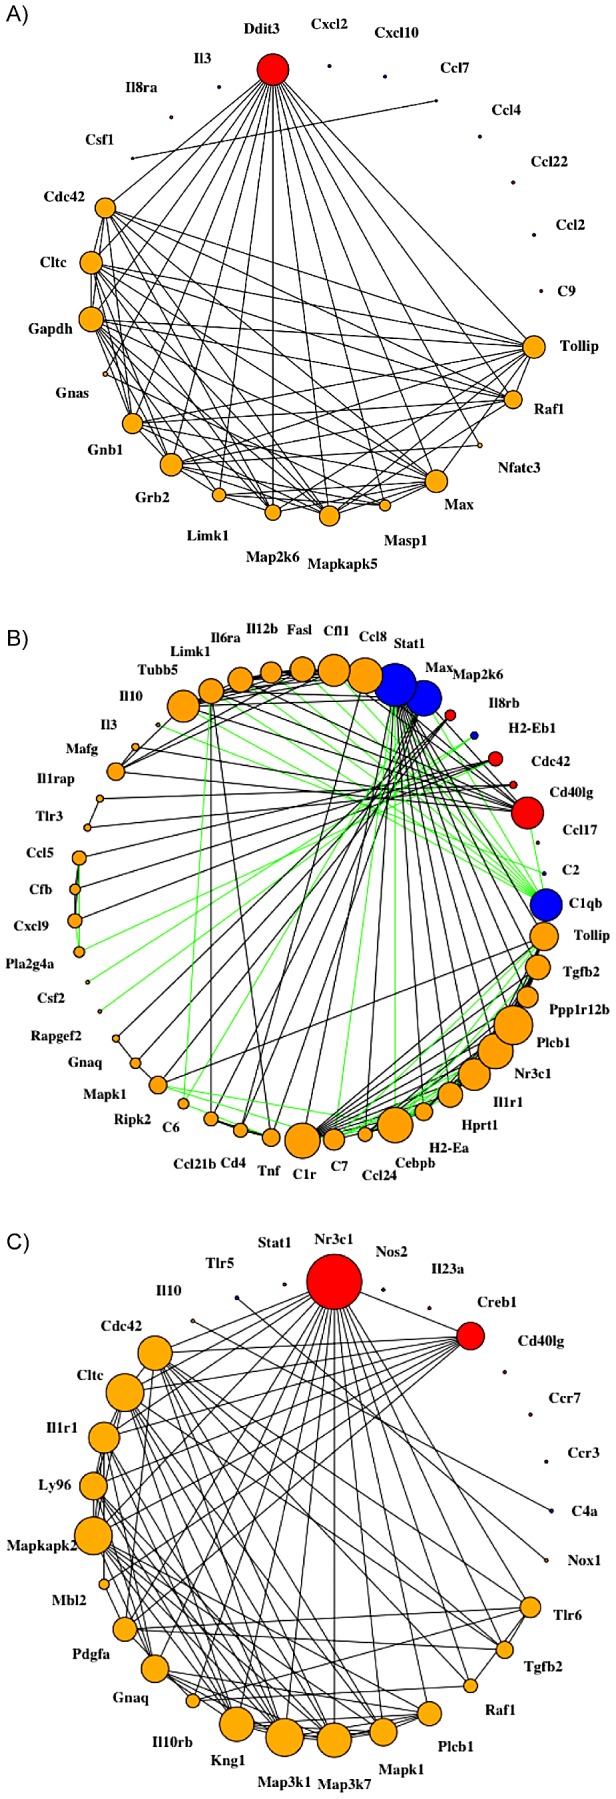
Figure 3. Maximally transition-relevant gene expression networks for (A) brain, (B) spleen, and (C) kidney in WNV-infected Swiss Webster mice.

Blue and red nodes are maximally transition-relevant (MTR) genes, defined as those genes that changed their expression levels above the 95th percentile of the tissue-specific K-L divergence calculated between gene expression in WNV RNA(+) infected tissue relative to WNV RNA(−) infected tissue. Blue indicates upregulation of the gene and red labels down-regulation. Edges between two genes X and Y in the networks indicate a Pearson correlation coefficient P(X,Y) with an absolute value over 97.5-th percentile. Orange nodes are first-degree neighbors of the MTR genes. Black edges indicate a positive correlation coefficient (i.e. between the two genesand green indicates a negative coefficient (anti-correlation). Nodes are sized by degree, i.e. how many other genes the node is connected to. Lung is not shown because there were no connections present at the significance threshold used. Liver is not shown as there was no conclusive evidence of liver infection.
