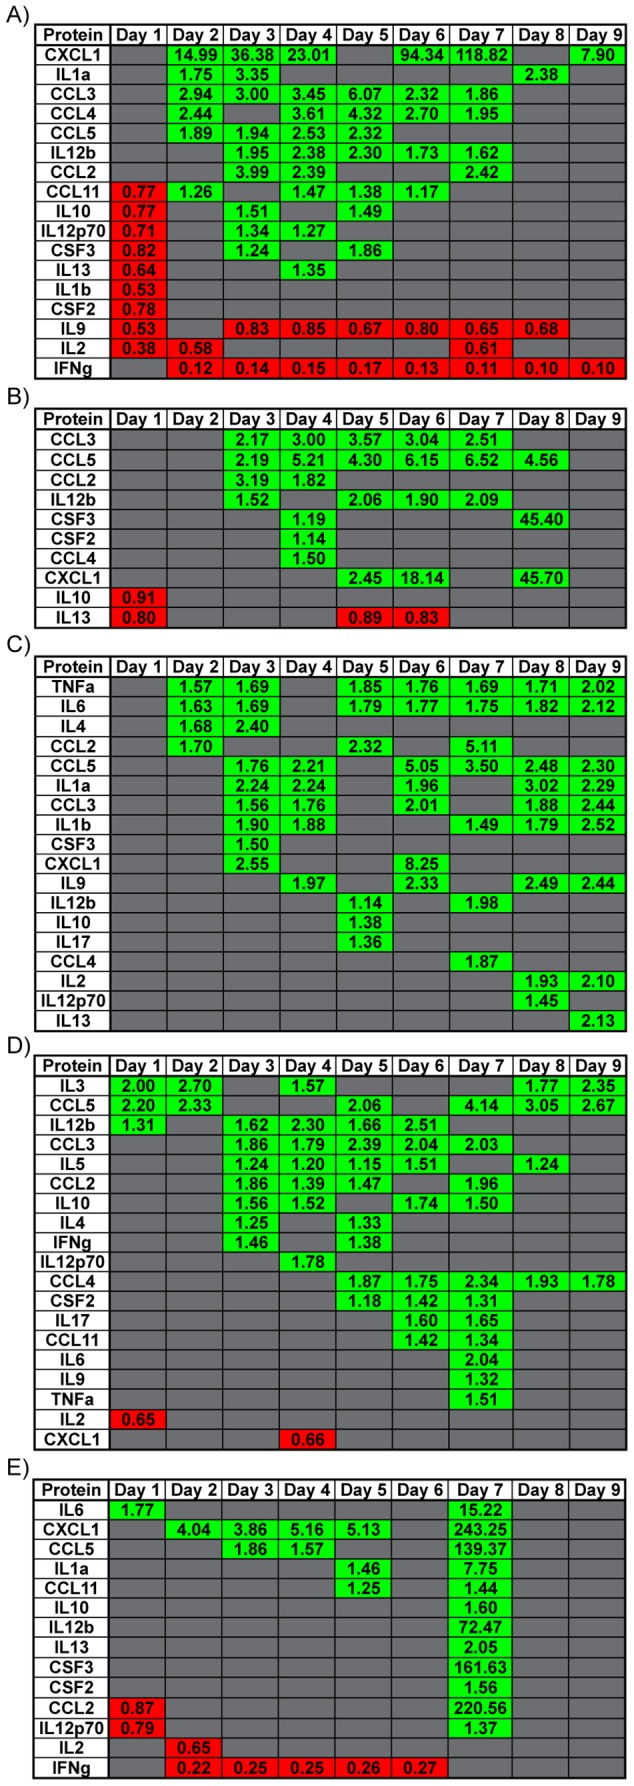
Figure 8. Dynamic Protein Expression profiles in various tissues over course of infection.

Heatmap of specific genes in (A) spleen, (B) lung, (C) liver, (D) kidney and (E) brain that had a significant change in protein expression per day over the course of infection. Green shaded boxes represent genes that were upregulated and red shaded boxes represent genes that were downregulated. Fold change for each gene is denoted within each shaded box. Data points represent n = 3 mice per day, p<0.05 consider statistically significant.
