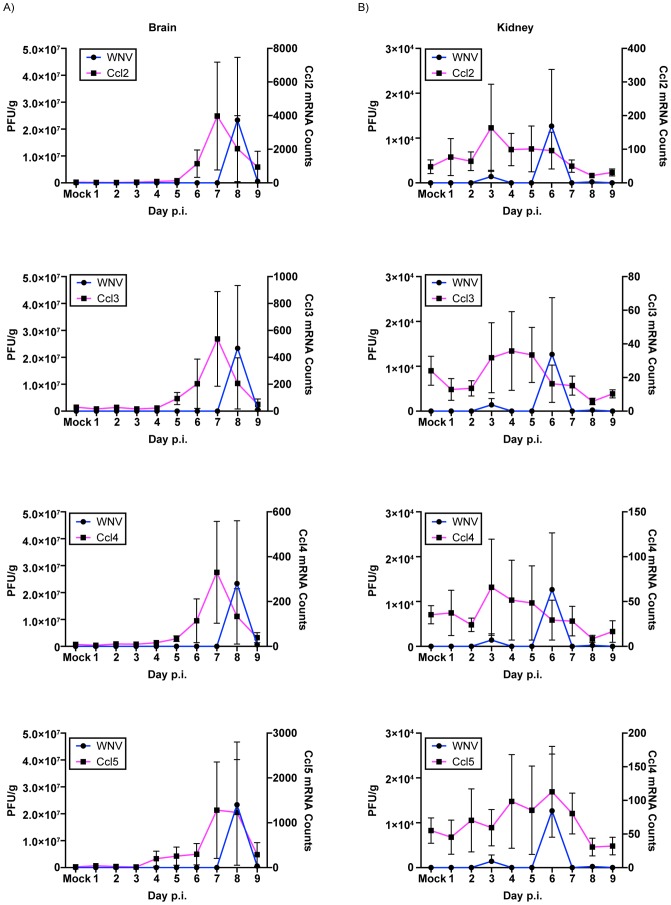
Figure 10. Kinetics of gene expression and WNV viral titers in the (A) kidney and (B) brain of WNV infected SW mice.
WNV titers (left Y-axis) and gene expression levels (right Y-Axis) were plotted over time and the kinetics of viral titers and gene expression analyzed. CCL2, CCL3, CCL4 and CCL5 had similar expression kinetics that mirrored those of WNV titers in the tissues. Error bars represent SEM; n = 3 mice per day. * represents statistically significant changes for mRNA (magenta).

