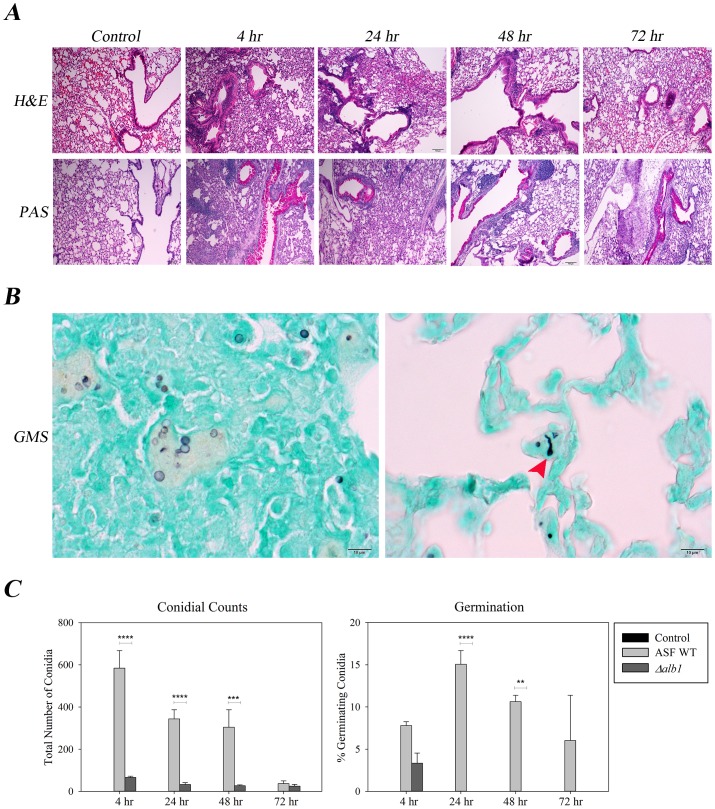
Figure 2. Histopathology of sections derived from Aspergillus fumigatus WT exposed mice.
A) Representative histopathology sections from WT exposed mice sacrificed at the indicated time points. Top panel-H&E stained sections at 100× magnification, Bottom panel-PAS stained sections at 100× magnification. B) GMS stained sections at 400× magnification. Black arrow heads indicate swollen conidia (24 hr), while red arrow heads indicate conidia germination and emergence of hyphal tubes (48 hr). C) Quantification of conidia and germination (swollen conidia+germ tube formation) over time. Values were obtained by quantifying the number of conidia visualized by counting 100 random fields of view covering both lung fields at a magnification of 400×. Conidia were considered swollen when the size was >2× that of resting conidia. Data are presented as the average ± standard error of measure. ****P≤0.0001, ***P≤0.001, **P≤0.01.

