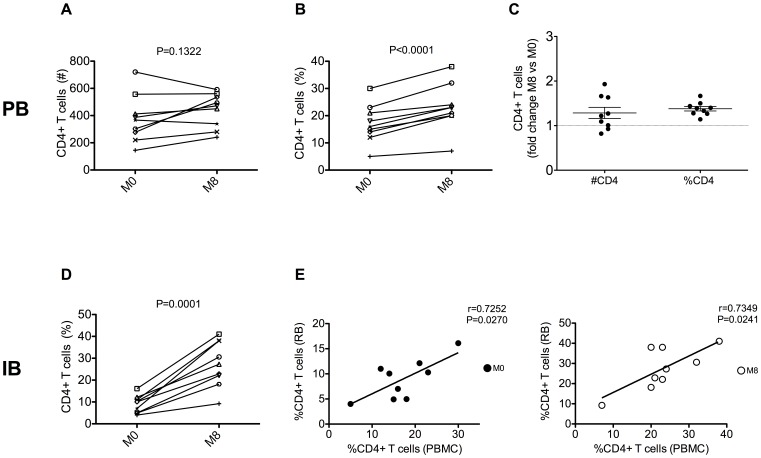
Figure 2. Effects of short-term cART on peripheral and intestinal CD4 T cell levels.
Longitudinal assessment of CD4 T cells in peripheral blood (PB) and intestinal biopsy (IB) during eight months of cART treatment. The absolute number (A) and percentage (B) of PB CD4 T cells are shown before (M0) and after eight months (M8) of cART. Fold change over baseline (M0) of CD4 T cell absolute number (left) and percentage (right) is depicted in (C). Extent of intestinal CD4 T cells before (M0) and after (M8) cART (D). Positive correlation between the percentages of CD4 T cells in PB and IB atM0 (close circles) and M8 (open circles) (E).

