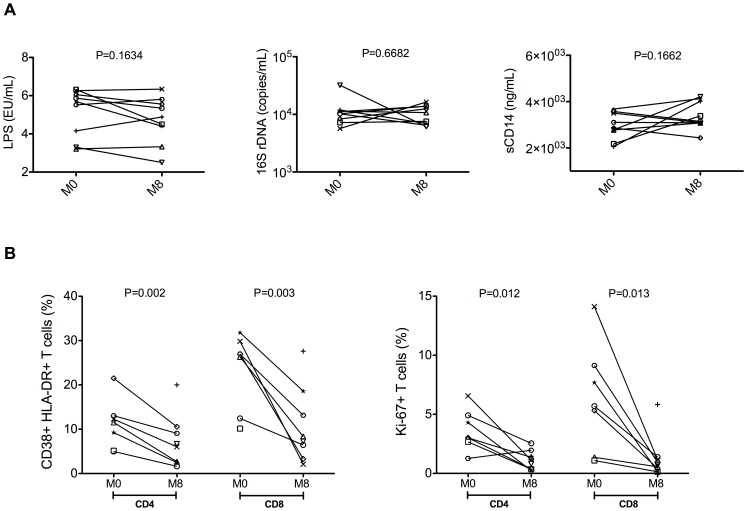
Figure 5. Effects of short-term cART on microbial translocation and T cell activation/proliferation.
Plasma levels of lipopolysaccharide (LPS), 16S rDNA and soluble CD14 (sCD14) before (M0) and after eight months (M8) of cART (A). LPS and sCD14 were measured by ELISA, while 16S rDNA by PCR. Percentages of activated (as determined by expression of CD38 and HLA-DR; left), and proliferating (as determined by expression of Ki-67) staining; right) CD4 and CD8 T cells (B).

