
Figure 5. Characterization of the exp1-parA region.
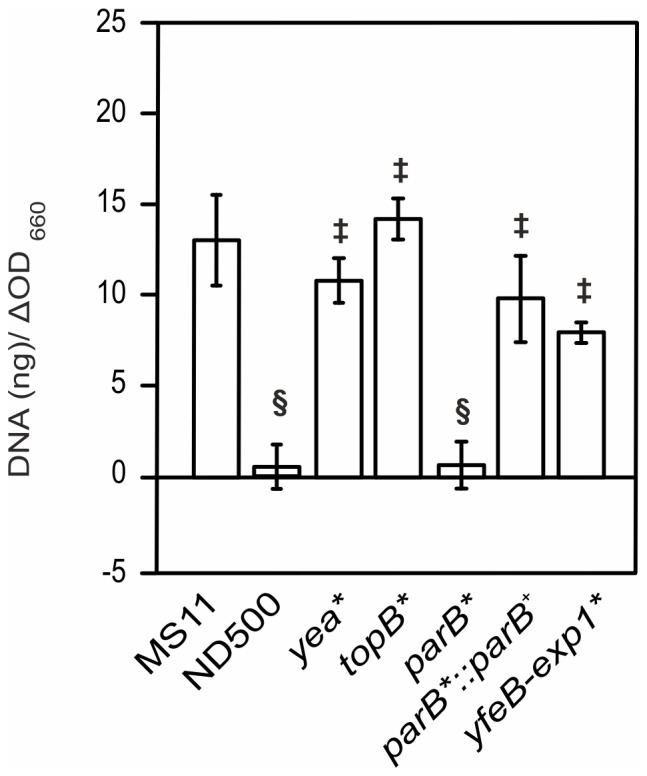
A) Fluorometric detection of secreted DNA of mutants created in the exp1-parA region. Fluorometric detection of secreted DNA was performed as in Figure 2. * indicates a strain in which the respective gene or gene region is disrupted by insertion of an ermC containing plasmid via insertion-duplication mutagenesis. parB*::parB+ indicates the strain in which the parB* mutant is complemented by expressing parB from the complementation site between the aspC and lctP genes. § indicates a Student's T-test P-value≤0.05 compared to wild-type; ‡, indicates no statistical difference compared to WT.