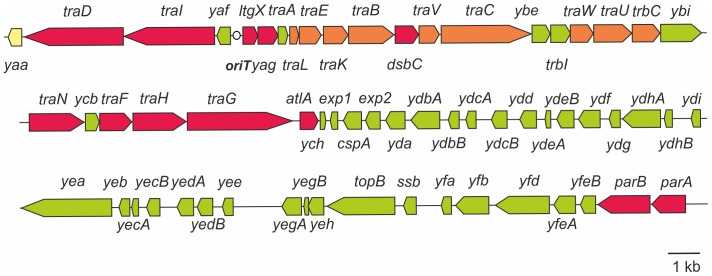
Figure 6. Complete mutational analysis of the genes of the gonoccocal genetic island.
Schematic representation of the genetic map of the GGI of N. gonorrhoeae. Red and orange indicate genes in which mutations resulted in a decrease in DNA secretion. Green indicates genes in which mutations had no effect on DNA secretion. Yellow indicates yaa, of which deletion resulted in an increase of DNA in the medium. For the genes colored in red, secretion could be restored by complementation. For the genes colored in orange no complementation experiments were performed. The dot indicates the origin of transfer (oriT).

