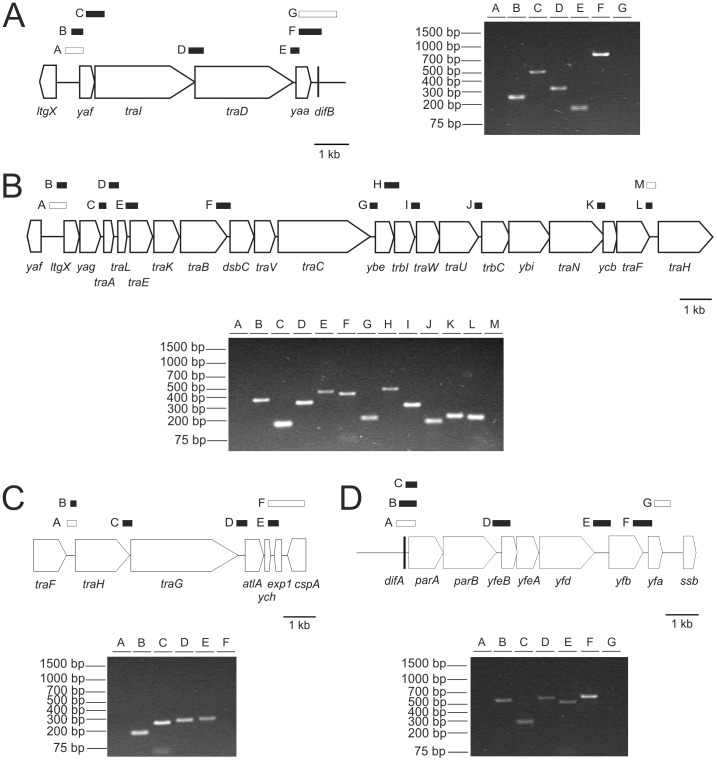
Figure 7. Transcriptional analysis of the genes encoded within the Gonococcal Genetic Island.
PCR with different primer combinations on cDNA generated by reverse transcription of RNA isolated from strain MS11 was used to identify operons within the GGI. The results of the transcriptional analysis using different primer pairs within A) the yaf-yaa, B), the ltgX-traF, C) the traH-exp1 and D) the parA-yfa regions are depicted. The right (A) or lower (B, C, D) part of the figure shows the agarose gels on which the PCR products, obtained with the different primer combinations, were loaded. The left (A) or upper (B, C, D) part of the figure shows a representation of the genetic structure of the operon. Genes are indicated by arrows and the expected PCR products by boxes over the genes. Primer combinations for which a PCR product was obtained are indicated by black boxes and primer combinations for which no PCR product was obtained are indicated by white boxes. The primer combinations used are described in Table S3.

