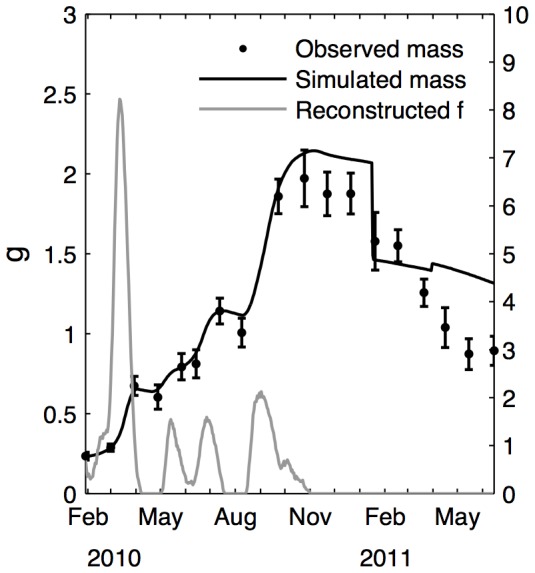
Figure 6. Comparisons of observed and modeled DFM with the reconstructed functional response.

Functional response without standardization (grey) was obtained with DFM observations. Simulated DFM is shown by solid lines, observations are shown by dots.
