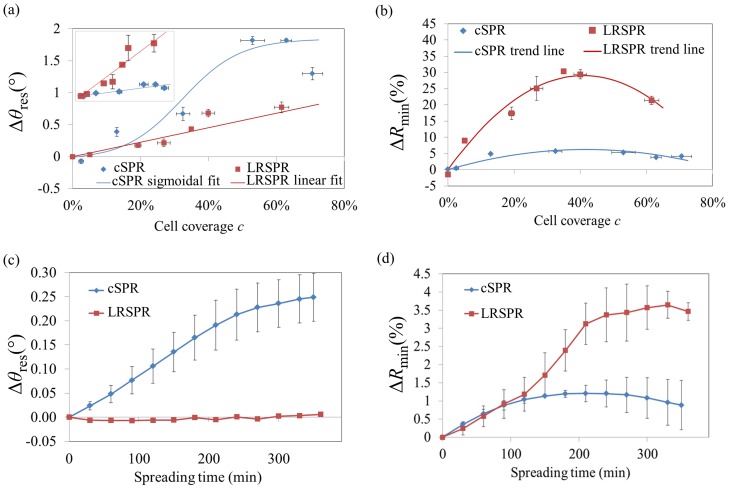
Figure 3. Comparison of cSPR and LRSPR spectra parameters for the two experimental schemes.
Dependence of θ res (a) and R min (b) with respect to the cell coverage (round cells). The inset in (a) represents Δθ res/HWHM, the slope of which is the figure of merit of the sensor. It was found that FOM = 1.30%−1 and FOM = 7.39%−1 for cSPR and LRSPR, respectively, yielding a 5.7-fold enhancement in the case of LRSPR. Dependence of Δθ res (c), and R min (d) with respect to the cell spreading. The error bars represent the standard errors.

