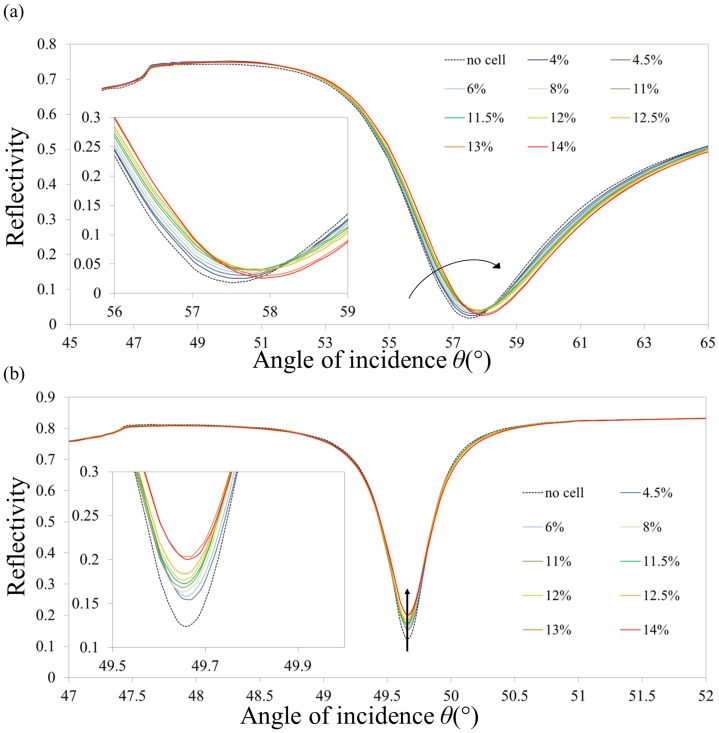
Figure 4. Typical reflectivity spectra of cSPR and LRSPR upon cellular spreading.
(a) cSPR spectra and (b) LRSPR spectra. The cell seeding density was of 150 cells/mm2. The arrows show the evolution of the spectra. The insets show a close-up of the minimum of intensity. The coverage values were inferred from the curve in Figure S2.

