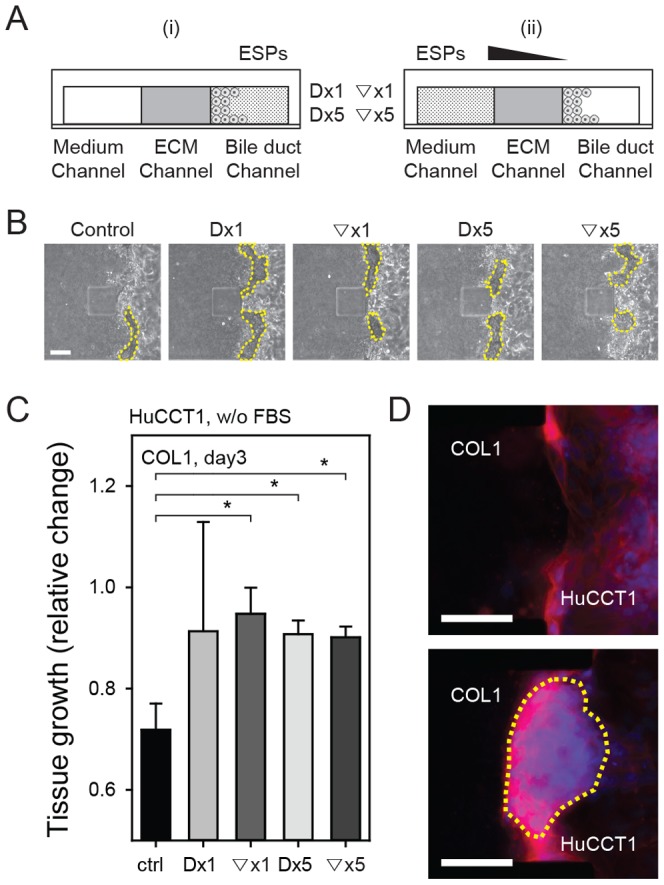
Figure 4. Formation of a HuCCT1 cell tumor mass in the microfluidic assay system.

(A) ESPs exposure conditions: (i) direct stimulation (Dx1, Dx5), and (ii) indirect stimulation via gradient formation (▽x1, ▽x5). ×1 = 800 ng/ml; ×5 = 4,000 ng/ml. (B) Phase contrast images depicting growth of the HuCCT1 tumor mass. (C) Normalized growth of HuCCT1 cell tumors. *P<0.05 compared with the control. Significance was analyzed by Student's t-test. Error bars, ± SEM. (D) Fluorescence image of the HuCCT1 tumor mass (outlined in yellow dashed line) under untreated control (above) and Dx5 (below) conditions. Scale bars = 100 µm.
