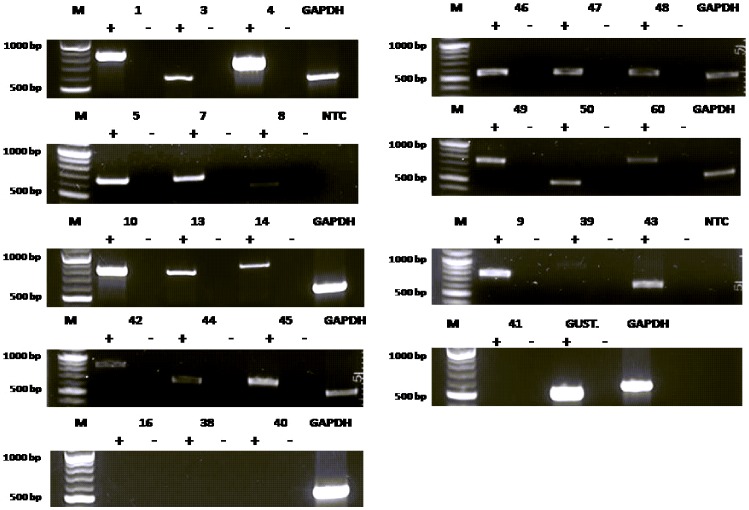
Figure 1. Reverse transcriptase (RT)-PCR analysis of the expression of bitter taste receptors (TAS2Rs) in hPASMCs.
Agarose gel electrophoresis (1%) analysis of the RT-PCR products showed that 21 T2Rs were expressed in hPASMCs. GAPDH was used as an internal control for the PCR reactions. + and – represent the addition and omittance of reverse transcriptase in the reaction respectively. NTC represents a no template control in which the cDNA template was omitted. M represents 100 bp molecular weight standard (NEB). All transcripts were observed at the expected amplicon size. Each agarose gel electrophoresis is representative of 4–5 independent experiments.

