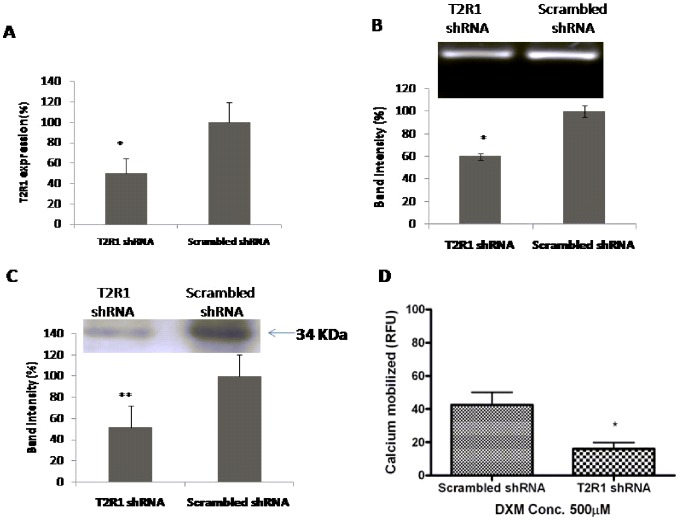
Figure 3. Knockdown of T2R1 in hPASMCs.
A. Primary cultures of hPASMCs were transfected with scrambled shRNA (control) or shRNA T2R1. 48 h post-transfection, cells were used for RNA extraction and real-time PCR. Results are normalized to GAPDH expression. Percentage (%) knockdown efficiency was computed using 2−ΔΔCT method. Values are mean ± SEM, n = 5. Statistical significance was determined by student t-test, *p<0.05 vs scrambled shRNA (control). B. Representative agarose gel analysis of figure 3A. Lane 1 represents T2R1-shRNA and lane 2 scrambled shRNA. Quantification of T2R1 knockdown is represented via bar graph using the densitometric analysis. Statistical significance was determined by student t-test, *p<0.05 vs scrambled shRNA. C. Western blot analysis showing T2R1 knockdown at the protein level in hPASMCs. Band intensity was normalized to expression of β-actin. Bar graph shows the quantitative analysis of receptor knockdown in the blot. Statistical significance was determined by student t-test, **p<0.01 vs scrambled shRNA (control). D. Functional effects of T2R1 knockdown in hPASMCs. hPASMCs were transfected with scrambled shRNA (control) and shRNA T2R1. 48 h post-transfection, cells were used for calcium mobilization experiment, and stimulated with 500 µM DXM. Data were collected from five independent experiments carried out in triplicate. Values are mean ± SEM, n = 5. Statistical significance was determined by student t-test, *p<0.05 vs scrambled shRNA (control).

