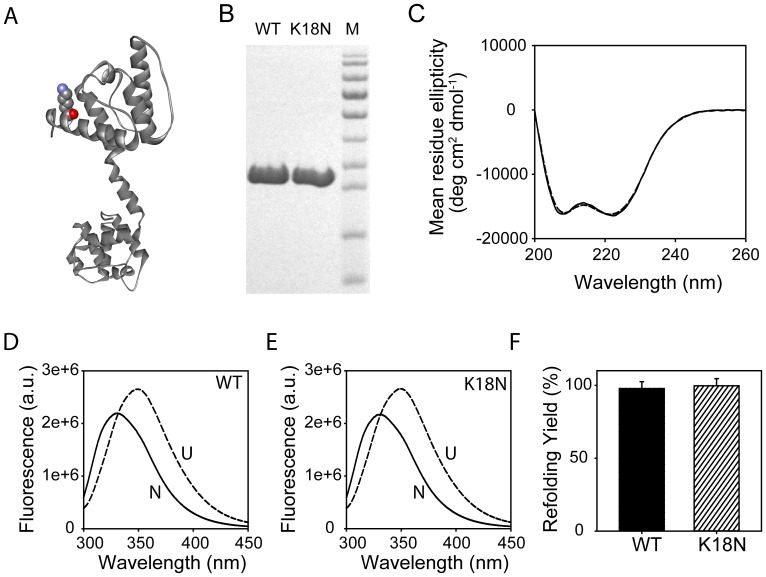
Figure 1. Expression, purification, and biophysical characterization of the K18N mutant and the WT.
(A) Ribbon diagram of the X-ray crystal structure of dystrophin N-ABD (1DXX.pdb) with the mutated lysine shown in a space-filling or cpk (Corey, Pauling, and Koltun) model. (B) SDS-PAGE of purified proteins. Lane M corresponds to molecular weight markers (bottom to top: 11, 17, 26, 34, 43, 56, 72, 96, 130, and 170 kDa respectively). (C) CD spectra of the WT (solid line) and the mutant (dashed line). (D) Fluorescence spectra of the native (solid line) and denatured (dashed line) WT. (E) Fluorescence spectra of the native (solid line) and denatured (dashed line) mutant. (F) Refolding yields of the two proteins.

