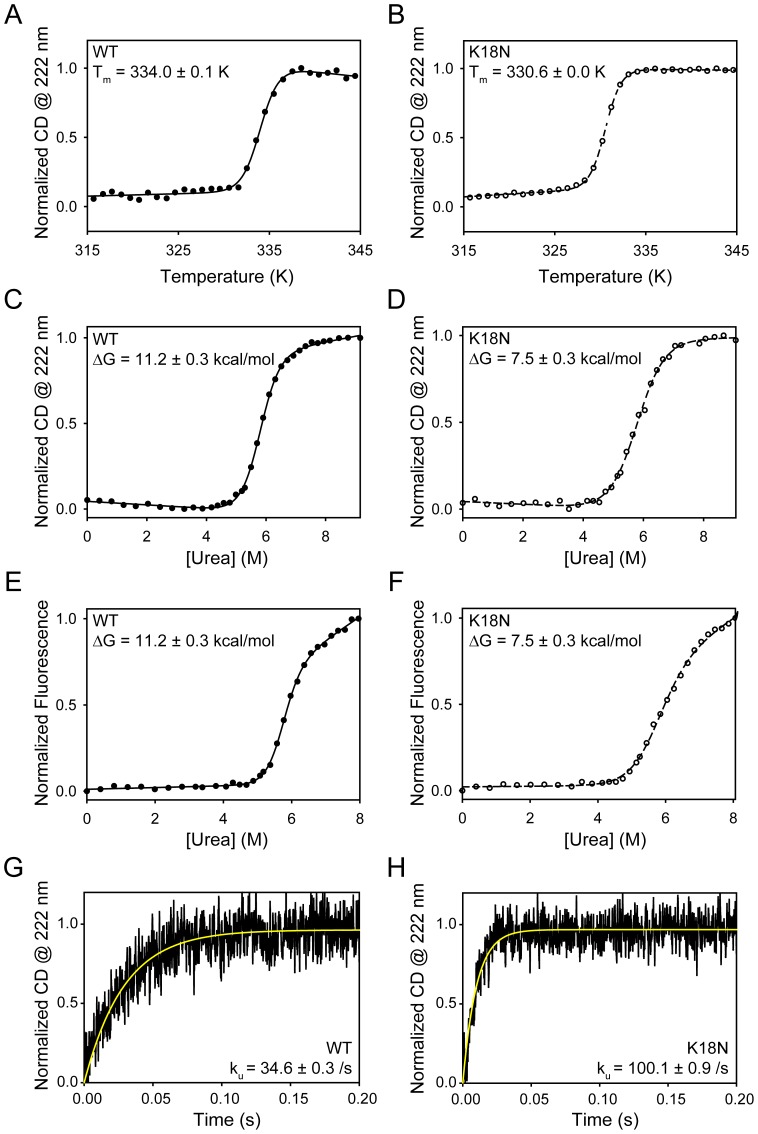
Figure 2. Effect of K18N mutation on protein stability and unfolding.
(A) and (B) show the thermal melts of the WT and the mutant respectively. Circular dichroism (CD) @ 222 nm was used to monitor protein unfolding. (C) and (D) show the denaturant melts of the WT and the mutant measured using CD @ 222 nm as the signal. (E) and (F) show the corresponding denaturant melts with fluorescence (λex = 280 nm, λem = 350 nm) as the signal. (G) and (H) show the stopped-flow unfolding kinetics of the WT and the mutant starting from their native states, measured using CD @ 222 nm as the signal.

