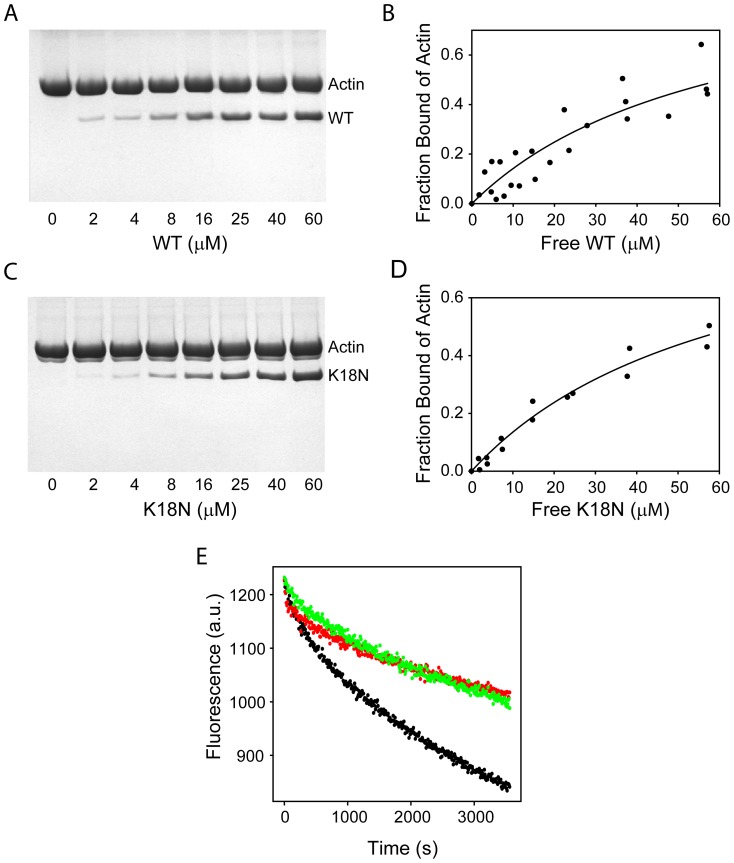
Figure 4. Effect of K18N mutation on protein function.
(A) – (D) show the results from actin co-sedimentation assay. (A) & (C) show SDS-PAGE of the pellets after co-sedimentation of varying concentration of the WT or the mutant with a fixed concentration of F-actin. The upper and lower bands in SDS-PAGE indicate actin and bound WT (or mutant) in the pellet. (B) and (D) show the fraction of actin bound as a function of free protein, calculated from the protein band intensities from SDS-PAGE after correcting for the differential staining of the dye. (E) Actin depolymerization assay. Green and red represent the depolymerization kinetics of F-actin in the presence of the WT or the mutant, respectively. Black trace corresponds to the kinetics in the absence of the WT or the mutant.

