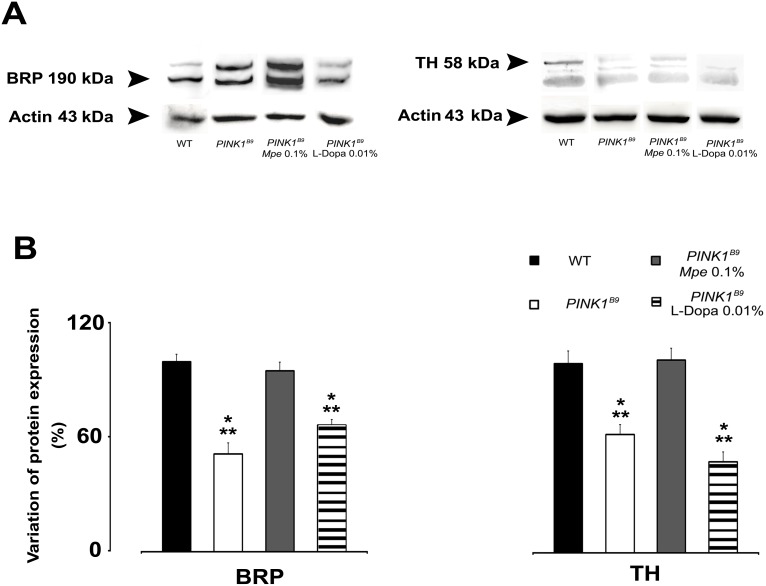
Figure 6. Effects of Mpe and L-Dopa on BRP and TH.
(A): Representative western blot analysis of head homogenates from adult wild type (WT), untreated PINK1B9 and in Mpe (0.1%)- and L-Dopa (0.01%)-treated PINK1B9 flies showing labeled bands of Bruchpilot protein (BRP), of Tyrosine hydroxylase (TH) and of the loading control actin (from top to bottom). (B): Percentage of protein expression variation of BRP and TH in WT, untreated PINK1B9 and in Mpe (0.1%)- and L-Dopa (0.01%)-treated PINK1B9 flies. Values are average + SEM. *indicates p<0.05 at one-way ANOVA with respect to WT; **indicates p<0.05 at one-way ANOVA (HSD post-hoc test) with respect to PINK1B9 Mpe 0.1%.

