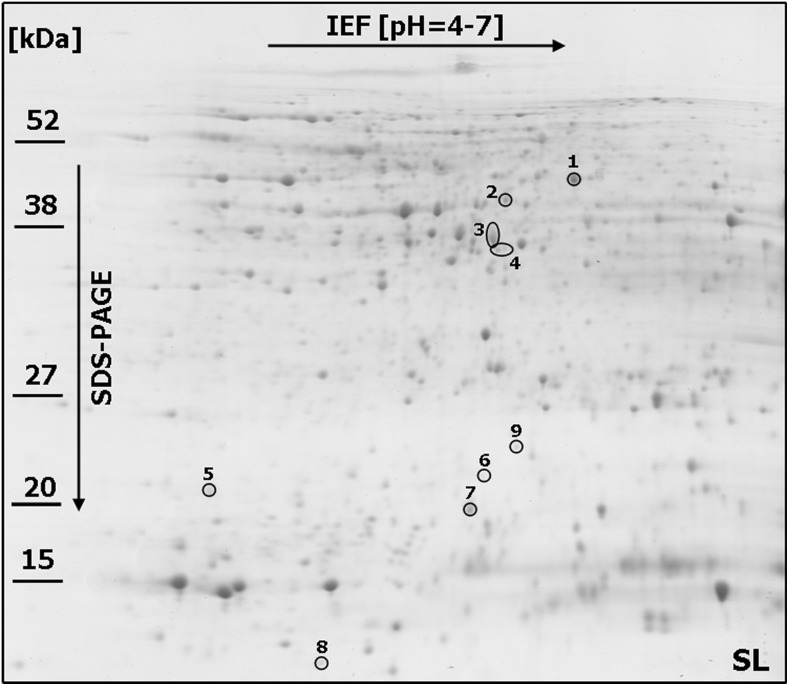
Figure 2. One representative 2-DE protein map of winter wheat (Triticum aestivum) kernel after Fusarium culmorum infection (Fusarium-damaged kernels) for the line more susceptible (SL) to Fusarium head blight.
The spots with differentially accumulated (p≤0.05) proteins (1–9) identified in the SL, are circled with a solid line. Molecular weight (MW) scale is shown.

