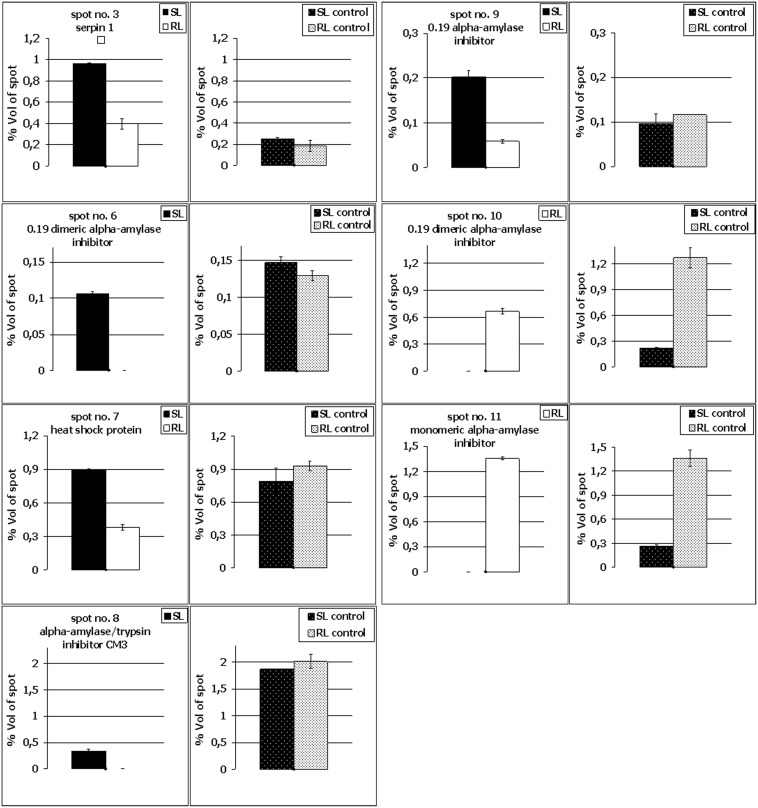
Figure 4. Comparison of selected kernel protein abundance after Fusarium culmorum infection and in the control conditions in the winter wheat (Triticum aestivum) SL (line more susceptible to Fusarium head blight) and the RL (line more resistant to Fusarium head blight).
Spot numbering is the same as in Fig. 2, 3, S1 and S2. The standard deviation bars are shown. Only proteins identified from homogenous spots are shown.

