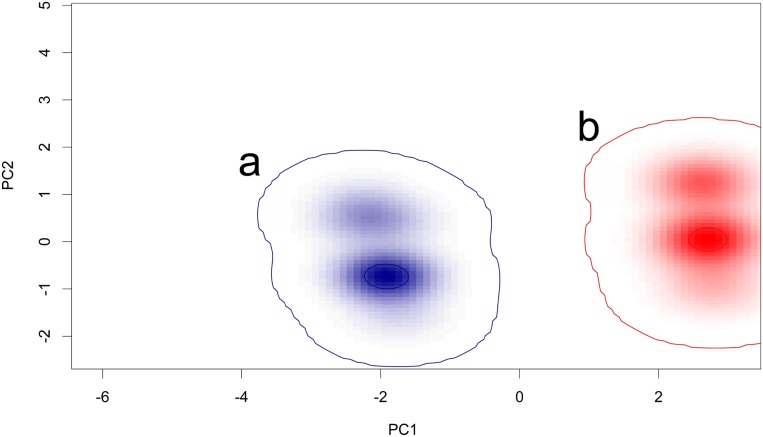
Figure 4. Graphical representation of the environmental niches for Rhinolophus euryale.
a: Sardinian population; b: other Italian populations. In the example, niche were generated with Principal Component Analysis calibrated on the whole environmental space including the presence records where the species occur.

