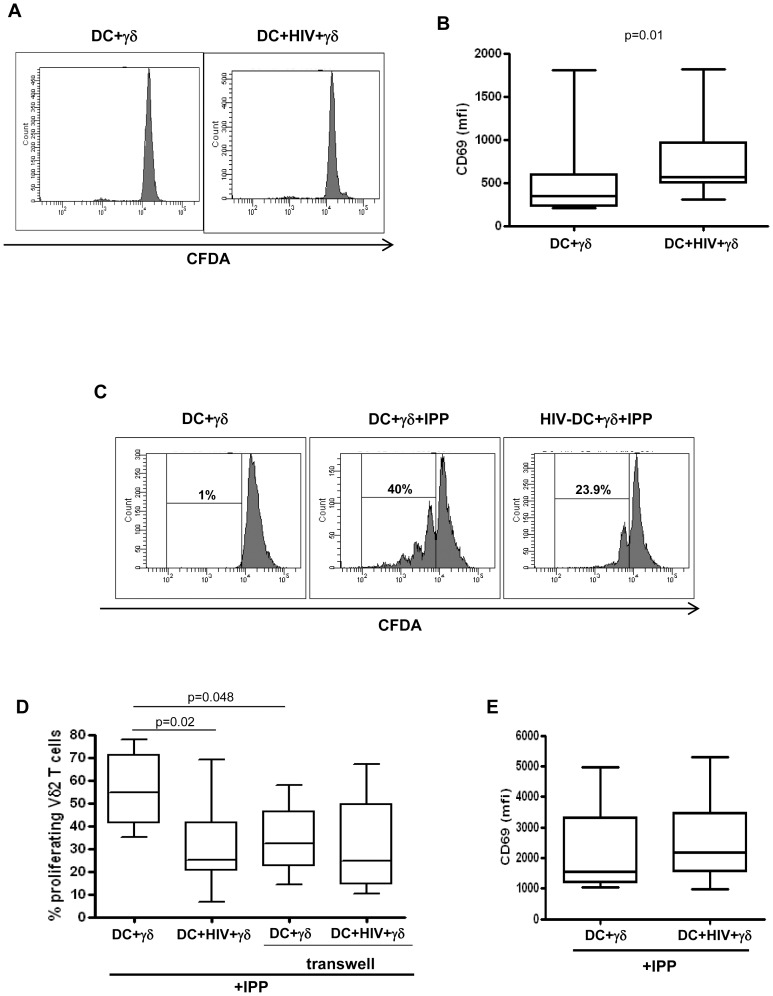
Figure 1. Effects of HIV-infected MoDC on Vγ9Vδ2 T cells proliferation.
MoDC were infected with HIVBAL and cultured with CFDA-SE labeled Vγ9Vδ2 T cells. After 5 days, Vγ9Vδ2 T cells proliferation and activation was evaluated by flow cytometry. (A) Representative histogram plots of one out of seven independent experiments showing Vγ9Vδ2 T cells proliferation. (B) CD69 expression on Vγ9Vδ2 T cells in the indicated conditions. Vγ9Vδ2 T cells labeled with CFDA-SE were stimulated with IPP in the presence of MoDC infected or not with HIVBAL. After 5 days, Vγ9Vδ2 T cells proliferation was evaluated by flow cytometry. (C) Representative histogram plots of one out of seven independent experiments showing Vγ9Vδ2 T cells proliferation. (D) Percentage of proliferating Vγ9Vδ2 T cells upon IPP stimulation in the indicated conditions. (E) CD69 expression (mean fluorescence intensity, mfi) on IPP stimulated Vγ9Vδ2 T cells cultured with HIV infected or uninfected MoDC. Results are shown as Box and Whiskers: the box encompasses the interquartile range of individual measurements, the horizontal bar-dividing line indicates the median value, and the whiskers represents maximum and minimum values.

