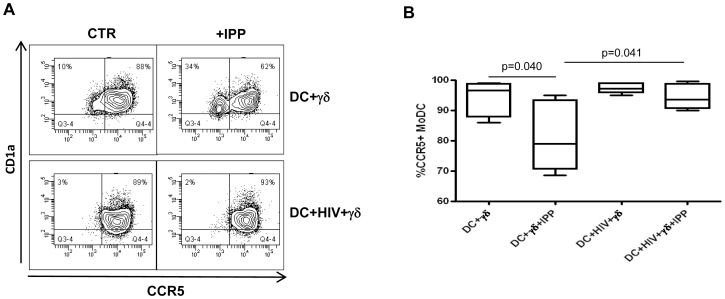
Figure 6. HIV-infected MoDC fail to down-regulate CCR5.
MoDC were infected with HIVBAL and cultured with purified γδT cells for 5 days. MoDC phenotype were evaluated by flow cytometry. (A) Representative histogram plots of one out of seven independent experiments showing CCR5 expression on MoDC in the indicated conditions. (B) Percentage of CCR5+ MoDC cultured with Vγ9Vδ2 T cells in the indicated conditions. Results are shown as Box and Whiskers: the box encompasses the interquartile range of individual measurements, the horizontal bar-dividing line indicates the median value, and the whiskers represents maximum and minimum values.

