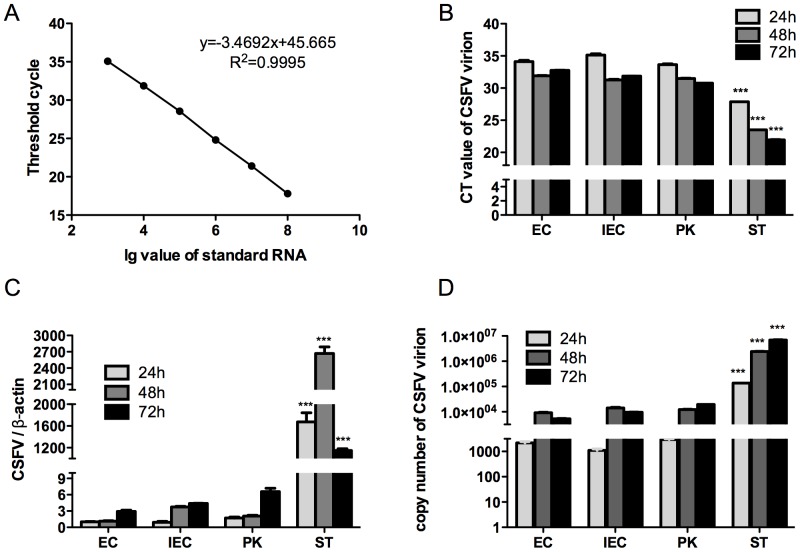
Figure 1. Establishment of standard curve for one-step qRT-PCR and evaluation of CSFV proliferation.
A) Standard curve for one-step qRT-PCR. X-axis denotes Lg value of standard RNA and Y-axis denotes CT value (cycle for threshold, stands for the minimum cycle number of fluorescent quantitative PCR for Thermal Cycler to reach the defaulted value when collecting each tube’s fluorescence signal). The smaller the CT value is, the higher amount of interested RNA the sample contains. B) CT value from one-step qRT-PCR, showing the amount of CSFV virions in cell-culture liquid from four cell lines at 24 h, 48 h and 72 h p.i., respectively. C) CSFV proliferation amount in cell-culture liquid calculated according to the standard curve. The following formula is implemented: copy number = (45.665 - CT value)/3.4692. D) Evaluation of CSFV proliferation rate in four cell lines using two-step qPCR with β-actin as the norm. Statistical difference was calculated between ST group and EC, IEC or PK groups at the same time point, for example, *** marked above ST-24 column denotes extremely significant difference between ST-24 and EC-24, IEC-24 or PK-24 (This explanation applies to Fig. 1B, 1C and 1D).

