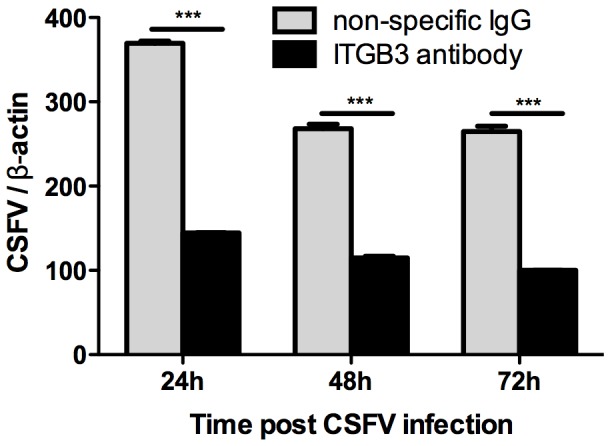
Figure 5. Evaluation of the CSFV proliferation rate in integrinβ3 functionally blocked cells.

Y-axis denotes the normalized amount of proliferated CSFV assessed by two-step qPCR while X-axis denotes different time points p.i. Cells were pre-incubated with mouse-anti-swine integrin β3 monoclonal antibody at 37°C for 2 h before CSFV infection. Cells incubated with the non-specific IgG were used as the negative control. ***p<0.001 represents extremely significant difference.
